To use all functions of this page, please activate cookies in your browser.
My watch list
my.chemeurope.com
my.chemeurope.com
With an accout for my.chemeurope.com you can always see everything at a glance – and you can configure your own website and individual newsletter.
- My watch list
- My saved searches
- My saved topics
- My newsletter
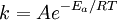
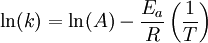
Arrhenius plotAn Arrhenius plot displays the logarithm of a rate (ln(k), ordinate axis) plotted against inverse temperature (1 / T, abscissa). Arrhenius plots are often used to analyze the effect of temperature on the rates of chemical reactions. For a single rate-limited thermally activated process, an Arrhenius plot gives a straight line, from which the activation energy and the pre-exponential factor can both be determined. Additional recommended knowledgeThe Arrhenius equation given in the form: can be written equivalently as: When plotted in the manner described above, the value of the extrapolated "y-intercept" will correspond to ln(A), and the gradient of the line will be equal to − Ea / R. The pre-exponential factor, A, is a constant of proportionality that takes into account a number of factors such as the frequency of collision between and the orientation of the reacting particles. The expression − Ea / RT represents the fraction of the molecules present in a gas which have energies equal to or in excess of activation energy at a particular temperature. See also |
| This article is licensed under the GNU Free Documentation License. It uses material from the Wikipedia article "Arrhenius_plot". A list of authors is available in Wikipedia. |