To use all functions of this page, please activate cookies in your browser.
My watch list
my.chemeurope.com
my.chemeurope.com
With an accout for my.chemeurope.com you can always see everything at a glance – and you can configure your own website and individual newsletter.
- My watch list
- My saved searches
- My saved topics
- My newsletter
X-ray crystallography
X-ray crystallography is the science of determining the arrangement of atoms within a crystal from the manner in which a beam of X-rays is scattered from the electrons within the crystal. The method produces a three-dimensional picture of the density of electrons within the crystal, from which the mean atomic positions, their chemical bonds, their disorder and sundry other information can be derived. By definition, a crystal is a solid in which a particular arrangement of atoms (its unit cell) is repeated indefinitely along three principal directions known as the basis (or lattice) vectors. A wide variety of materials can form crystals — such as salts, metals, minerals, semiconductors, as well as various inorganic, organic and biological molecules — which has made X-ray crystallography fundamental to many scientific fields. The oldest and most precise method of X-ray crystallography is single-crystal X-ray diffraction, in which a beam of X-rays is reflected from evenly spaced planes of a single crystal, producing a diffraction pattern of spots called reflections.[1] Each reflection corresponds to one set of evenly spaced planes within the crystal. The density of electrons within the crystal is determined from the position and brightness of the various reflections observed as the crystal is gradually rotated in the X-ray beam; this density, together with supplementary data, allows the atomic positions to be inferred. For single crystals of sufficient purity and regularity, X-ray diffraction data can determine the mean chemical bond lengths and angles to within a few thousandths of an Ångström and to within a few tenths of a degree, respectively. The data also allow the static and dynamic disorder in the atomic positions to be estimated, which is usually less than a few tenths of an Ångström. At its most basic level, X-ray crystallography is useful in identifying known materials, characterizing new materials and in discerning materials that appear similar by other experiments. However, X-ray crystal structures have many other applications; for example, they can account for unusual electronic or elastic properties of a material, shed light on chemical interactions and processes, or serve as the basis for understanding enzymatic mechanisms and designing pharmaceuticals against diseases. The term "X-ray crystallography" is also sometimes applied to methods that involve X-ray diffraction from polycrystalline materials, such as powders of small crystals studied by X-ray powder diffraction. The technique of single-crystal X-ray crystallography has three basic steps. The first — and often most difficult — step is to obtain an adequate crystal of the material under study. The crystal should be sufficiently large, pure in composition and regular in structure, with no large internal imperfections such as cracks or twinning. In the second step, the crystal is placed in an intense beam of X-rays, usually of a single wavelength (monochromatic X-rays), producing the regular pattern of reflections. As the crystal is gradually rotated, previous reflections disappear and new ones appear; the intensity of every spot is recorded meticulously at every orientation of the crystal. Multiple data sets may have to be collected, with each set covering slightly more than half a full rotation of the crystal and containing tens of thousands of reflection intensities. In the third step, these data are combined computationally with complementary chemical information to produce and refine a model of the arrangement of atoms within the crystal. The final, refined model — now called a crystal structure — is usually stored in a public database. As the crystal's unit cell becomes larger, the atomic-level picture provided by X-ray crystallography becomes less well-resolved (more "fuzzy") for a given number of observed reflections. Two limiting cases of X-ray crystallography are often discerned, "small-molecule" and "macromolecular" crystallography. Small-molecule crystallography typically involves crystals with fewer than 100 atoms in their asymmetric unit; such crystal structures are usually so well resolved that its atoms can be discerned as isolated "blobs" of electron density. By contrast, macromolecular crystallography often involves tens of thousands of atoms in the unit cell. Such crystal structures are generally less well-resolved (more "smeared out"); the atoms and chemical bonds appear as tubes of electron density, rather than as isolated atoms. In general, small molecules are also easier to crystallize than macromolecules; however, X-ray crystallography has proven possible even for viruses with hundreds of thousands of atoms. Additional recommended knowledge
HistoryScientific pre-history of crystals and X-raysCrystals have long been admired for their regularity and symmetry, but they were not investigated scientifically until the 17th century, when Johannes Kepler hypothesized (1611) that the hexagonal symmmetry of snowflake crystals was due to a regular packing of spherical water particles.[2] Crystal symmetry was investigated experimentally by Nicolas Steno (1669), who showed that the angles between the faces are the same in every exemplar of a single type of crystal,[3] and by René Just Haüy (1784), who discovered that every face of a crystal can be described by three small integers, the so-called Miller indices. These studies led Haüy to the correct idea that crystals are a regular three-dimensional array (a Bravais lattice) of atoms and molecules; a single unit cell is repeated indefinitely along three principal directions that are not necessarily perpendicular. In the 19th century, a complete catalog of the possible symmetries of a crystal was worked out by Johann Hessel,[4] Auguste Bravais,[5] Yevgraf Fyodorov,[6], Arthur Schönflies[7] and (belatedly) William Barlow. On the basis of the available data and physical reasoning, Barlow proposed several crystal structures in the 1880s that were ultimately proven correct by X-ray crystallography;[8] however, the available data were too few in the 1880s to accept his models as conclusive. X-rays were discovered by Wilhelm Conrad Röntgen in 1895, just as the studies of crystal symmetry were being concluded. Physicists were initially uncertain of the nature of X-rays, although it was soon suspected (correctly) that they were waves of electromagnetic radiation, in other words, another form of light. At that time, the wave model of light — specifically, the Maxwell theory of electromagnetic radiation — was well accepted among scientists, and experiments by Charles Glover Barkla showed that X-rays exhibited phenomena associated with electromagnetic waves, including transverse polarization and spectral lines akin to those observed in the visible wavelengths. Single-slit experiments in the laboratory of Arnold Sommerfeld suggested the wavelength of X-rays was roughly 1 Angström, one ten millionth of a millimetre. Being composed of photons, X-rays also exhibit particle-like properties, e.g., in the ionization of gases; these properties led William Henry Bragg to suggest in 1907 that X-rays were not electromagnetic radiation,[9] since the concept of the photon was relatively new (1905)[10] and not generally accepted.[11][12] However, Bragg's view was itself not broadly accepted and the observation of X-ray diffraction in 1912[13] confirmed for most scientists that X-rays were a form of electromagnetic radiation. Any remaining doubt was resolved in 1922, when Arthur Compton confirmed the photon model by studying the scattering of X-rays from electrons.[14] The idea of combining crystals and X-raysTo summarize, crystals are regular arrays of atoms and X-rays can be considered waves of electromagnetic radiation. Atoms scatter X-rays, primarily through their electrons; just as an ocean wave striking a lighthouse produces secondary circular waves emanating from the lighthouse, so an X-ray striking an electron produces secondary spherical waves emanating from the electron. This phenomenon is known as scattering, and the electron (or lighthouse) is known as the scatterer. As described in the Mathematical derivation below, the X-ray scattering is determined by the density of electrons within the crystal. Since the energy of an X-ray is much greater than that of an atomic electron, the scattering may be modeled as Thomson scattering, the interaction of an electromagnetic ray with a free electron; this model is generally adopted to describe the polarization of the scattered radiation. The intensity of Thomson scattering declines as 1/m² with the mass m of the charged particle that is scattering the radiation; hence, the atomic nuclei, which are thousands of times heavier than an electron, contribute negligibly to the scattered X-rays. Any wave impinging on a regular array of scatterers produces diffraction, as predicted first by Francesco Maria Grimaldi in 1665. To produce significant diffraction, the spacing between the scatterers and the wavelength of the impinging wave should be roughly similar in size. James Gregory observed the optical diffraction of sunlight through a bird's feather in the later 17th century. The first man-made diffraction grating was constructed by David Rittenhouse in 1787, and improved by Joseph von Fraunhofer in 1821. Similarly, X-ray diffraction results from an electromagnetic wave (the X-ray) impinging on a regular array of scatterers (the crystal). By good fortune, the wavelength of X-rays and the spacing between unit cells in crystals are typically of the same order of magnitude (1-100 Ångströms); prior to X-ray diffraction, however, the spacings between unit cells in a crystal were not known with certainty. The idea that crystals could be used as a diffraction grating for X-rays arose in 1912 in a conversation between Paul Peter Ewald and Max von Laue in the English Garden in Munich. Ewald had proposed a resonator model of crystals for his thesis, but this model could not be validated using visible light, since the wavelength was much larger than the spacing between the resonators. Von Laue realized that electromagetic radiation of a shorter wavelength was needed to observe such small spacings, and suggested that X-rays might have a wavelength comparable to the unit-cell spacing in crystals. Von Laue worked with two technicians, Walter Friedrich and his assistant Paul Knipping, to shine a beam of X-rays through a sphalerite crystal and record its diffraction on a photographic plate. After being developed, the plate showed a large number of well-defined spots arranged in a pattern of intersecting circles around the spot produced by the central beam.[13] Von Laue developed a law that connects the scattering angles and the size and orientation of the unit-cell spacings in the crystal, for which he was awarded the Nobel Prize in Physics in 1914.[15] Development from 1912 to 1920After von Laue's pioneering research, the field developed rapidly, most notably by physicists William Lawrence Bragg and his father William Henry Bragg. In 1912-1913, the younger Bragg developed Bragg's law, which connects the observed scattering with reflections from evenly spaced planes within the crystal.[16] The earliest structures were generally simple and marked by one-dimensional symmetry. However, as computational and experimental methods improved over the next decades, it became to feasible to deduce reliable atomic positions for more complicated two- and three-dimensional arrangements of atoms in the unit-cell. The potential of X-ray crystallography for determining the structure of molecules and minerals — then only known vaguely from chemical and hydrodynamic experiments — was realized immediately. The earliest structures were generally simple inorganic crystals and minerals. The first atomic-resolution structure to be solved (in 1914) was that of table salt,[17] which proved the existence of ionic compounds and that crystals are not necessarily comprised of molecules. The structure of diamond was solved in the same year,[18] proving the tetrahedral arrangement of its chemical bonds and showing that the C-C single bond was 1.52 Ångströms. Other early structures included copper,[19] calcium fluoride (CaF2, also known as fluorite), calcite (CaCO3) and pyrite (FeS2)[20] in 1914; spinel (MgAl2O4) in 1915;[21] the rutile and anatase forms of titanium dioxide (TiO2) in 1916;[22] pyrochroite and, by extension, brucite [Mn(OH)2 and Mg(OH)2, respectively] in 1919;[23] and wurtzite (hexagonal ZnS) in 1920.[24] The structure of graphite was solved in 1916[25] by the related method of powder diffraction,[26] which was developed by Peter Debye and Paul Scherrer and, independently, by Albert Hull in 1917.[27] The structure of graphite was determined from single-crystal diffraction in 1924 by two groups independently.[28][29] Hull also used the powder method to determine the structures of various metals, such as iron[30] and magnesium.[31] Contributions to chemistry and material scienceX-ray crystallography has led to a better understanding of chemical bonds and non-covalent interactions. The initial studies revealed the typical radii of atoms, and confirmed many theoretical models of chemical bonding, such as the tetrahedral bonding of carbon in the diamond structure,[18] the octahedral bonding of metals observed in ammonium hexachloroplatinate (IV),[32] and the resonance observed in the planar carbonate group[20] and in aromatic molecules.[33][34] Kathleen Lonsdale's 1928 structure of hexamethylbenzene[34] established the hexagonal symmetry of benzene and showed a clear difference in bond length between the aliphatic C-C bonds and aromatic C-C bonds; this finding led to the idea of resonance between chemical bonds, which had profound consequences for the development of chemistry.[35] Her conclusions were anticipated by William Henry Bragg, who published models of naphthalene and anthracene in 1921 based on other molecules, an early form of molecular replacement.[33] Also in the 1920s, Victor Moritz Goldschmidt and later Linus Pauling developed rules for eliminating chemically unlikely structures and for determining the relative sizes of atoms. These rules led to the structure of brookite (1928) and an understanding of the relative stability of the rutile, brookite and anatase forms of titanium oxide. The distance between two covalently bonded atoms is a sensitive measure of the bond strength and its bond order; thus, X-ray crystallographic studies have led to the discovery of even more exotic types of bonding in inorganic chemistry, such as metal-metal double bonds,[36] metal-metal quadruple bonds,[37] and three-center, two-electron bonds.[38] X-ray crystallography — or, strictly speaking, an inelastic Compton scattering experiment — has also provided evidence for the partially covalent character of hydrogen bonds.[39] In the field of organometallic chemistry, the X-ray structure of ferrocene initiated scientific studies of sandwich compounds,[40] while that of Zeise's salt stimulated research into "back bonding" and metal-pi complexes in general.[41] Finally, X-ray crystallography had a pioneering role in the development of supramolecular chemistry, particularly in clarifying the structures of the crown ethers and the principles of host-guest chemistry. In material sciences, many complicated inorganic and organometallic systems have been analyzed using single-crystal methods, such as fullerenes, metalloporphyrins, and other complicated compounds. Single-crystal diffraction is also used in the pharmaceutical industry, due to recent problems with polymorphs. The major factors affecting the quality of single-crystal structures is crystal's size and regularity; recrystallization is a commonly used technique to improve these factors in small-molecule crystals. The Cambridge Structural Database contains over 400,000 structures; over 99% of these structures were determined by X-ray diffraction. Contributions to mineralogy and metallurgyIn mineralogy, a systematic X-ray crystallographic study of the silicates was undertaken in the 1920s, beginning with the structure of garnet in 1924 by Menzer. As the Si/O ratio is altered, the resulting crystals exhibited significant changes in their internal arrangements. Machatschki extended these insights to minerals in which aluminum substitutes for silicon in the silicates. In metallurgy, the first alloy crystal structures began to be determined in the mid-1920s.[42] Linus Pauling's structure of the alloy Mg2Sn[43] led to his theory governing the stability and structure of complex ionic crystals.[44] Early organic and small biological molecules
The first structure of an organic compound, hexamethylenetetramine, was solved in 1923.[45] This was followed by several studies of long-chain fatty acids, which are an important component of biological membranes.[46] In the 1930s, the structures of much larger molecules with two-dimensional complexity began to be solved. A significant advance was the structure of phthalocyanine,[47] a large planar molecule that has an approximate four-fold symmetry and resembles porphyrins found in nature, such as heme, corrin and chlorophyll. X-ray crystallography of biological molecules took off with Dorothy Crowfoot Hodgkin, who solved the structures of cholesterol (1937), vitamin B12 (1945) and penicillin (1954), for which she was awarded the Nobel Prize in Chemistry in 1964. In 1969, she succeeded in solving the structure of insulin, on which she worked for over thirty years.[48]
Protein crystallographyCrystal structures of proteins (which are irregular and hundreds of times larger than cholesterol) began to be solved in the late 1950's, beginning with the structure of sperm whale myoglobin by Max Perutz and Sir John Cowdery Kendrew, for which they were awarded the Nobel Prize in Chemistry in 1962.[49] Since that success, over 39000 X-ray crystal structures of proteins, nucleic acids and other biological molecules have been determined.[50] For comparison, the nearest competing method, NMR spectroscopy has produced roughly 6000 structures.[51] Moreover, crystallography can solve structures of arbitrarily large molecules, whereas solution-state NMR is restricted to relatively small molecules (less than 70 kDa). X-ray crystallography is now used routinely by scientists to determine how a pharmaceutical interacts with its protein target and what changes might be advisable to improve it.[52] However, intrinsic membrane proteins remain challenging to crystallize because they require detergents or other means to solubilize them in isolation, and such detergents often interfere with crystallization. Such membrane proteins are a large component of the genome and include many proteins of great physiological importance, such as ion channels and receptors.[53][54] Relationship to other scattering techniques
Elastic vs. inelastic scatteringX-ray crystallography is a form of elastic scattering; the outgoing X-rays have the same energy as the incoming X-rays, only with altered direction. Since the energy of a photon is inversely proportional to its wavelength, elastic scattering means that the outgoing photons have the same wavelength as the incoming photons. By contrast, inelastic scattering occurs when energy is transferred from the incoming X-ray to the crystal, e.g., by exciting an inner-shell electron to a higher energy level. Such inelastic scattering changes the wavelength of the outgoing beam, making it longer and less energetic. Inelastic scattering is useful for probing such excitations of matter, but are not as useful in determining the distribution of scatterers within the matter, which is the goal of X-ray crystallography. X-rays range in wavelength from 10 to 0.01 nanometers (one billionth of a meter); a typical wavelength used for crystallography is roughly 1 Å (0.1 nm), which is on the scale of covalent chemical bonds and the radius of a single atom. Longer-wavelength photons (such as ultraviolet radiation) would not have sufficient resolution to determine the atomic positions. At the other extreme, shorter-wavelength photons such as gamma rays are difficult to produce in large numbers, difficult to focus, and interact too strongly with matter, producing particle-antiparticle pairs. Therefore, X-rays are the "sweetspot" for wavelength when determining atomic-resolution structures from the scattering of electromagnetic radiation. Other types of X-ray scatteringX-ray diffraction involves the scattering of X-rays from a single crystal. Other forms of elastic X-ray scattering include powder diffraction, SAXS and several types of X-ray fiber diffraction, which was used by Rosalind Franklin in determining the double-helix structure of DNA. In general, X-ray diffraction produces isolated spots ("reflections"), while the other methods produce smooth, continuous scattering. In general, X-ray diffraction offers more structural information than these other techniques; however, it requires a sufficiently large and regular crystal, which is not always possible to obtain. All of these scattering methods generally use monochromatic X-rays, X-rays that are restricted to a single wavelength with minor deviations. A broad spectrum of X-rays (that is, a blend of X-rays with different wavelengths) can also be used to carry out X-ray diffraction, a technique known as the Laue method. This is the method used in the original discovery of X-ray diffraction. Laue scattering provides much structural information with only a short exposure to the X-ray beam, and is therefore used in structural studies of very rapid events (time-resolved X-ray crystallography). However, it is not as well-suited as monochromatic scattering for determining the full atomic structure of a crystal. It is better suited to crystals with relatively simple atomic arrangements, such as minerals. The Laue back reflection mode records X-rays scattered backwards also from a broad spectrum source. This is useful if the sample is too thick or bulky for X-rays to transmit through it. The diffracting planes in the crystal are determined by knowing that the normal to the diffracting plane bisects the angle between the incident beam and the diffracted beam. A Greninger chart can be used [55] to interpret the back reflection Laue photograph. The X-calibre RTXDB and MWL 110 are commercial systems for Laue back reflection pattern recording. This technique can be used in materials analysis or non destructive inspection. Electron and neutron diffractionAs derived below, elastic scattering can be represented as a Fourier transform of the density of the scatterers, as long as the scattering is weak; the scattered beams should be much less intense than the incoming beam. When the scattering is weak, the scattered beams pass through the remainder of the crystal without undergoing a second scattering event. (Such re-scattered waves are called "secondary scattering".) Since X-rays interact relatively weakly with the electrons, this is generally not a significant consideration; however, any sufficiently thick crystal will produce secondary scattering. By contrast, electron beams may produce strong secondary scattering even for small crystals (e.g., 100 μm) used in X-ray crystallography. In such cases, extremely thin samples, roughly 100 nanometers or less, must be used to avoid secondary scattering; the primary scattered electron beams leave the sample before they have a chance to undergo secondary scattering. Since this thickness corresponds roughly to the diameter of many viruses, a promising direction is the electron diffraction of isolated macromolecular assemblies, such as viral capsids and molecular machines, which may be carried out with a cryo-electron microscope. Neutron diffraction is an excellent method for structure determination, although it has been difficult to obtain intense, monochromatic beams of neutrons in sufficient quantities. Traditionally, nuclear reactors have been used, although the new Spallation Neutron Source holds much promise in the near future. Being uncharged, neutrons scatter much more readily from the atomic nuclei rather than from the electrons. Therefore, neutron scattering is very useful for observing the positions of light atoms with few electrons, especially hydrogen, which is essentially invisible in the X-ray diffraction of larger molecules. Neutron scattering also has the remarkable property that the solvent can be made invisible by adjusting the ratio of normal water, H2O, and heavy water, D2O. Although hardware involved in electron scattering, neutron scattering, and x-ray scattering is very different, the resulting data is analyzed using the same coherent diffraction imaging techniques. Advantages of a crystalA crystalline sample is by definition periodic; a crystal is composed of many unit cells repeated indefinitely in three independent directions. Such periodic systems have a Fourier transform that is concentrated at periodically repeating points in reciprocal space known as Bragg peaks; the Bragg peaks correspond to the reflection spots observed in the diffraction image. Since the amplitude at these reflections grows linearly with the number N of scatterers, the observed intensity of these spots should grow quadratically, like N². In other words, using a crystal concentrates the weak scattering of the individual unit cells into a much more powerful, coherent reflection that can be observed above the noise. This is an example of constructive interference. In a non-crystalline sample, molecules within that sample would be in random orientations and therefore would have a continuous Fourier spectrum that spreads its amplitude more uniformly and with a much reduced intensity, as is observed in SAXS. More importantly, the orientational information is lost. In the crystal, the molecules adopt the same orientation within the crystal, whereas in a liquid, powder or amorphous state, the observed signal is averaged over the possible orientations of the molecules. Although theoretically possible with sufficiently low-noise data, it is generally difficult to obtain atomic-resolution structures of complicated, asymmetric molecules from such rotationally averaged scattering data. An intermediate case is fiber diffraction in which the subunits are arranged periodically in at least one dimension. MethodsCrystallization
Although crystallography can be used to characterize the disorder in an impure or irregular crystal, crystallography generally requires a pure crystal of high regularity to solve for the structure of a complicated arrangement of atoms. Pure, regular crystals can sometimes be obtained from Nature or man-made materials, such as samples of metals, minerals or other macroscopic materials. The regularity of such crystals can sometimes be improved with annealing and other methods. However, in many cases, obtaining a diffraction-quality crystal is the chief barrier to solving its atomic-resolution structure.[56] Small-molecule and macromolecular crystallography differ in the range of possible techniques used to produce diffraction-quality crystals. Small molecules generally have few degrees of conformational freedom, and may be crystallized by a wide range of methods, such as chemical vapor deposition and recrystallisation. By contrast, macromolecules generally have many degrees of freedom and their crystallization must be carried out to maintain a stable structure. For example, proteins and larger RNA molecules cannot be crystallized if their tertiary structure has been unfolded; therefore, the range of crystallization conditions is restricted to solution conditions in which such molecules remain folded. Protein crystals are almost always grown in solution. The most common approach is to lower the solubility of its component molecules very gradually; however, if this is done too quickly, the molecules will precipitate from solution, forming a useless dust or amorphous gel on the bottom of the container. Crystal growth in solution is characterized by two steps: nucleation of a microscopic crystallite (possibly having only 100 molecules), followed by growth of that crystallite, ideally to a diffraction-quality crystal.[57] The solution conditions that favor the first step (nucleation) are not always the same conditions that favor the second step (its subsequent growth). The crystallographer's goal is to identify solution conditions that favor the development of a single, large crystal, since larger crystals offer improved resolution of the molecule. Consequently, the solution conditions should disfavor the first step (nucleation) but favor the second (growth), so that only one large crystal forms per droplet. If nucleation is favored too much, a shower of small crystallites will form in the droplet, rather than one large crystal; if favored too little, no crystal will form whatsoever. In some cases, the crystallographer can identify good solution conditions for growing very small crystals that do not continue to grow and which are too small for crystallography. In such cases, the tiny crystals can be transferred to new solution conditions that favor growth more strongly; the small crystals act as pre-nucleated seeds for subsequent growth. In an alternative approach, a larger but poor-quality crystal may be crushed, and the pieces used as seed crystals to obtain higher quality crystals. It is extremely difficult to predict good conditions for nucleation or growth of well-ordered crystals.[58] In practice, favorable conditions are identified by screening; a very large batch of the molecules is prepared, and a wide variety of crystallization solutions are tested.[59] Hundreds, even thousands, of solution conditions are generally tried before finding one that succeeds in crystallizing the molecules. The various conditions can use one or more physical mechanisms to lower the solubility of the molecule; for example, some may change the pH, some contain salts of the Hofmeister series or chemicals that lower the dielectric constant of the solution, and still others contain large polymers such as polyethylene glycol that drive the molecule out of solution by entropic effects. It is also common to try several temperatures for encouraging crystallization, or to gradually lower the temperature so that the solution becomes supersaturated. These methods require large amounts of the target molecule, as they use high concentration of the molecule(s) to be crystallized. Due to the difficult in obtaining such large quantities (milligrams) of crystallisation grade protein, dispensing robots have been developed that are capable of accurately dispensing crystallisation trial drops that are of the order on 100 nanoliters in volume. This means that roughly 10-fold less protein is used per-experiment when compared to crystallisation trials setup by hand (on the order on 1 microliters) [60]. Several factors are known to inhibit or mar crystallization. The growing crystals are generally held at a constant temperature and protected from shocks or vibrations that might disturb their crystallization. Impurities in the molecules or in the crystallization solutions are often inimical to crystallization. Conformational flexibility in the molecule also tends to make crystallization less likely, due to entropy. Ironically, molecules that tend to self-assemble into regular helices are often unwilling to assemble into crystals. Crystals can be marred by twinning, which can occur when a unit cell can pack equally favorably in multiple orientations; although recent advances in computational methods have begun to allow the structures of twinned crystals to be solved, it is still very difficult. Having failed to crystallize a target molecule, a crystallographer may try again with a slightly modified version of the molecule; even small changes in molecular properties can lead to large differences in crystallization behavior. Data collectionMounting the crystalOnce they are full-grown, the crystals are mounted so that they may be held in the X-ray beam and rotated. There are several methods of mounting. Although crystals were once loaded into glass capillaries with the crystallization solution (the mother liquor), a more modern approach is to scoop the crystal up in a tiny loop, made of nylon or plastic and attached to a solid rod, that is then flash-frozen with liquid nitrogen.[61] This freezing reduces the radiation damage of the X-rays, as well as the noise in the Bragg peaks due to thermal motion (the Debye-Waller effect). However, untreated crystals often crack if flash-frozen; therefore, they are generally pre-soaked in a cryoprotectant solution before freezing.[62] Unfortunately, this pre-soak may itself cause the crystal to crack, ruining it for crystallography. Generally, successful cryo-conditions are identified by trial and error. The capillary or loop is mounted on a goniometer, which allows it to be positioned accurately within the X-ray beam and rotated. Since both the crystal and the beam are often very small, the crystal must be centered within the beam to within roughly 25 microns accuracy, which is aided by a camera focused on the crystal. The most common type of goniometer is the "kappa goniometer", which offers three angles of rotation: the ω angle, which rotates about an axis roughly perpendicular to the beam; the κ angle, about an axis at roughly 50° to the ω axis; and, finally, the φ angle about the loop/capillary axis. When the κ angle is zero, the ω and φ axes are aligned. The κ rotation allows for convenient mounting of the crystal, since the arm in which the crystal is mounted may be swung out towards the crystallographer. The oscillations carried out during data collection (mentioned below) involve the ω axis only. An older type of goniometer is the four-circle goniometer, and its relatives such as the six-circle goniometer. X-ray sources
The mounted crystal is then irradiated with a beam of monochromatic X-rays. The brightest and most useful X-ray sources are synchrotrons; their much higher luminosity allows for better resolution. They also make it convenient to tune the wavelength of the radiation, which is useful for multi-wavelength anomalous dispersion (MAD) phasing, described below. Synchrotrons are generally national facilities, each with several dedicated beamlines where data is collected around the clock, seven days a week.
Smaller, weaker X-ray sources are often used in laboratories to check the quality of crystals before bringing them to a synchrotron and sometimes to solve a crystal structure. In such systems, electrons are boiled off of a cathode and accelerated through a strong electric potential of roughly 50 kV; having reached a high speed, the electrons collide with a metal plate, emitting bremsstrahlung and some strong spectral lines corresponding to the excitation of inner-shell electrons of the metal. The most common metal used is copper, which can be kept cool easily, due to its high thermal conductivity, and which produces strong Kα and Kβ lines. The Kβ line is sometimes suppressed with a thin layer (0.0005 in. thick) of nickel foil. The simplest and cheapest variety of sealed X-ray tube has a stationary anode and produces circa 2 kW of X-ray radiation. The more expensive variety has a rotating-anode type source that produces circa 14 kW of X-ray radiation. X-rays are generally filtered to a single wavelength (made monochromatic) and collimated to a single direction before they are allowed to strike the crystal. The filtering not only simplifies the data analysis, but also removes radiation that degrades the crystal without contributing useful information. Collimation is done either with a collimator (basically, a long tube) or with a clever arrangement of gently curved mirrors. Mirror systems are preferred for small crystals (under 0.3 mm) or with large unit cells (over 150 Å). Recording the reflections
When a crystal is mounted and exposed to an intense beam of X-rays, it scatters the X-rays into a pattern of spots or reflections that can be observed on a screen behind the crystal. A similar pattern may be seen by shining a laser pointer at a compact disc. The relative intensities of these spots provide the information to determine the arrangement of molecules within the crystal in atomic detail. The intensities of these reflections may be recorded with photographic film, an area detector or with a charge-coupled device (CCD) image sensor. The peaks at small angles correspond to low-resolution data, whereas those at high angles represent high-resolution data; thus, an upper limit on the eventual resolution of the structure can be determined from the first few images. Some measures of diffraction quality can be determined at this point, such as the mosaicity of the crystal and its overall disorder, as observed in the peak widths. Some pathologies of the crystal that would render it unfit for solving the structure can also be diagnosed quickly at this point. One image of spots is insufficient to reconstruct the whole crystal; it represents only a small slice of the full Fourier transform. To collect all the necessary information, the crystal must be rotated step-by-step through 180°, with an image recorded at every step; actually, slightly more than 180° is required to cover reciprocal space, due to the curvature of the Ewald sphere. However, if the crystal has a higher symmetry, a smaller angle such as 90° or 45° may be recorded. The axis of the rotation should generally be changed at least once, to avoid developing a "blind spot" in reciprocal space close to the rotation axis. It is customary to rock the crystal slightly (by 0.5-2°) to catch a broader region of reciprocal space. Multiple data sets may be necessary for certain phasing methods. For example, MAD phasing requires that the scattering be recorded at at least three (and usually four, for redundancy) wavelengths of the incoming X-ray radiation. A single crystal may degrade too much during the collection of one data set, owing to radiation damage; in such cases, data sets on multiple crystals must be taken.[63] Data analysisCrystal symmetry, unit cell, and image scaling
Having recorded a series of diffraction patterns from the crystal, each corresponding to a different crystal orientation, the crystallographer must now convert these two-dimensional images into a three-dimensional model of the density of electrons throughout the crystal using the mathematical technique of Fourier transforms. (The explanation for the relevance of this technique is given below.) Roughly speaking, each spot corresponds to a different type of variation in the electron density; the crystallographer must determine which variation corresponds to which spot (indexing), the relative strengths of the spots in different images (merging and scaling) and how the variations should be combined to yield the total electron density (phasing). In a picturesque analogy, the diffraction pattern corresponds to sheet music; the musician must determine which spot corresponds to which musical note, how loudly to play each note and how the various notes should be played together to produce the final musical piece. In order to process the data, a crystallographer must first index the reflections within the multiple images recorded. This means identifying the dimensions of the unit cell and which image peak corresponds to which position in reciprocal space. A byproduct of indexing is to determine the symmetry of the crystal, i.e., its space group. Some space groups can be eliminated from the beginning, since they require symmetries known to be absent in the molecule itself. For example, symmetries with reflection symmetries cannot be observed in chiral molecules; thus, only 65 space groups of 243 possible are allowed for protein molecules which are almost always chiral. Indexing is generally accomplished using an autoindexing routine[64]. Having assigned symmetry, the data is then integrated. This converts the hundreds of images containing the thousands of reflections into a single file, consisting of (at the very least) records of the Miller index of each reflection, and an intensity for each reflection (at this state the file often also includes error estimates and measures of partiality (what part of a given reflection was recorded on that image)). A full data set may consist of hundreds of separate images taken at different orientations of the crystal. The first step is to merge and scale these various images, that is, to identify which peaks appear in two or more images (merging) and to scale the relative images so that they have a consistent intensity scale. This is important, since the relative intensities of the peaks is the key information from which the structure is determined. The technique of crystallographic data collection and the often high symmetry of crystalline materials, means that many symmetry-equivalent reflections are recorded multiple times - this allows a merging or symmetry related R-factor to be calculated, based upon how similar the measured intensities of symmetry equivalent reflections are, thus giving a score to assess the quality of the data. Initial phasing
The data collected from a diffraction experiment is a reciprocal space representation of the crystal lattice. The position of each diffraction 'spot' is governed by the size and shape of the unit cell, and the inherent symmetry within the crystal. The intensity of each diffraction 'spot' is recorded, and is proportional to the square root of the structure factor amplitude. The structure factor is a complex number containing information relating to both the amplitude and phase of a wave. In order to obtain an interpretable electron density map, both amplitude and phase must be known (an electron density map allows a crystallographer to build a starting model of the molecule). The phase cannot be directly recorded during a diffraction experiment: this is known as the phase problem. Initial phase estimates can be obtained be in a variety of ways:
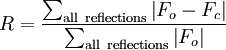
While all four of the above methods are used to solve the phase problem for protein crystallography, small molecule crystallography generally yields data suitable for structure solution using Direct methods/ab initio phasing. Model building and phase refinement
Having obtained initial phases, an initial model can be built. This model can be used to refine the phases, leading to an improved model, and so on. Given a model of some atomic positions, these positions and their respective Debye-Waller factors (accounting for the thermal motion of the atom - aka B-factors) can be refined to fit the observed diffraction data, ideally yielding a better set of phases. A new model can then be fit to the new electron density map and a further round of refinement is carried out. This continues until the correlation between the diffraction data and the model is maximized. The agreement is measured by an R-factor defined as A similar quality criterion is Rfree, which is calculated from a subset (~10%) of reflections that were not included in the structure refinement. Both R factors depend on the resolution of the data. As a rule of thumb, Rfree should be approximately the resolution in Ångströms divided by 10; thus, a data-set with 2 Å resolution should yield a final Rfree of roughly 0.2. Chemical bonding features such as stereochemistry, hydrogen bonding and distribution of bond lengths and angles are complementary measures of the model quality. Phase bias is a serious problem in such iterative model building. Omit maps are a common technique used to check for this. It may not be possible to observe every atom of the crystallized molecule - it must be remembered that the resulting electron density is an average of all the molecules within the crystal. In some cases, there is too much residual disorder in those atoms, and the resulting electron density for atoms existing in many conformations is smeared to such an extent that it is no longer detectable in the electron density map.. Weakly scattering atoms such as hydrogen are routinely invisible. It is also possible for a single atom to appear multiple times in an electron density map, e.g., if a protein sidechain has multiple (<4) allowed conformations. In still other cases, the crystallographer may detect that the covalent structure deduced for the molecule was incorrect, or changed. For example, proteins may be cleaved or undergo posttranslational modifications that were not detected prior to the crystallization. Deposition of the structureOnce the model of a molecule's structure has been finalized, it is often deposited in a crystallographic database such as the Protein Data Bank (for protein structures) or the Cambridge Structural Database (for small molecules). Many structures obtained in private commercial ventures to crystallize medicinally relevant proteins, are not deposited in public crystallographic databases. Diffraction theory
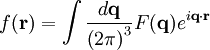
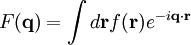
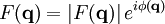
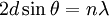
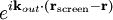
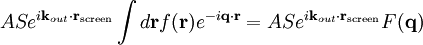
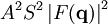
The main goal of X-ray crystallography is to determine the density of electrons f(r) throughout the crystal. To do this, X-ray scattering is used to collect data about its Fourier transform F(q), which is then inverted mathematically to obtain the density defined in real space, using the formula The corresponding formula for a Fourier transform is which will be used below. The vector q corresponds to a point in reciprocal space, that is, to a particular oscillation in the electron density as one moves in the direction in which q points. The length of q corresponds to 2π divided by the wavelength of the oscillation. The Fourier transform F(q) is generally a complex number, and therefore has a magnitude |F(q)| and a phase φ(q) related by the equation The intensities of the reflections observed in X-ray diffraction give us the magnitudes |F(q)| but not the phases φ(q). To obtain the phases, full sets of reflections are collected with known alterations to the scattering, either by modulating the wavelength past a certain absorption edge or by adding strongly scattering (i.e., electron-dense) metal atoms such as mercury. Combining the magnitudes and phases yields the full Fourier transform F(q), which may be inverted to obtain the electron density f(r). Crystals are often idealized as being perfectly periodic. In that ideal case, the atoms are positioned on a perfect lattice, the electron density is perfectly periodic, and the Fourier transform F(q) is zero except when q belongs to the reciprocal lattice (the so-called Bragg peaks). In reality, however, crystals are not perfectly periodic; atoms vibrate about their mean position, and there may be disorder of various types, such as mosaicity, dislocations, various point defects, and heterogeneity in the conformation of crystallized molecules. Therefore, the Bragg peaks have a finite width and there may be significant diffuse scattering, a continuum of scattered X-rays that fall between the Bragg peaks. Intuitive understanding by Bragg's lawAn intuitive understanding of X-ray diffraction can be obtained from the Bragg model of diffraction. In this model, a given reflection is associated with a set of evenly spaced sheets running through the crystal, usually passing through the centers of the atoms of the crystal lattice. The orientation of a particular set of sheets is identified by its three Miller indices (h, k, l), and let their spacing be noted by d. William Lawrence Bragg proposed a model in which the incoming X-rays are scattered specularly (mirror-like) from each plane; from that assumption, X-rays scattered from adjacent planes will combine constructively (constructive interference) when the angle θ between the plane and the X-ray results in a path-length difference that is an integer multiple n of the X-ray wavelength λ. A reflection is said to be indexed when its Miller indices (or, more correctly, its reciprocal lattice vector components) have been identified from the known wavelength and the scattering angle 2θ. Such indexing gives the unit-cell parameters, the lengths and angles of the unit-cell, as well as its space group. Since Bragg's law does not interpret the relative intensities of the reflections, however, it is generally inadequate to solve for the arrangement of atoms within the unit-cell; for that, a Fourier transform method must be carried out. Scattering as a Fourier transformThe incoming X-ray beam has a polarization and should be represented as a vector wave; however, for simplicity, let it be represented here as a scalar wave. We also ignore the complication of the time dependence of the wave and just focus on the wave's spatial dependence. Plane waves can be represented by a wave vector kin, and so the strength of the incoming wave at time t=0 is given by At position r within the sample, let there be a density of scatterers f(r); these scatterers should produce a scattered spherical wave of amplitude proportional to the local amplitude of the incoming wave times the number of scatterers in a small volume dV about r where S is the proportionality constant. Let's consider the fraction of scattered waves that leave with an outgoing wave-vector of kout and strike the screen at rscreen. Since no energy is lost (elastic, not inelastic scattering), the wavelengths are the same as are the magnitudes of the wave-vectors |kin| = |kout|. From the time that the photon is scattered at r until it is absorbed at rscreen, the photon undergoes a change in phase The net radiation arriving at rscreen is the sum of all the scattered waves throughout the crystal which may be written as a Fourier transform where q = kout - kin. The measured intensity of the reflection will be square of this amplitude The electron density f(r) is a real function, which imposes a constraint on its Fourier transform. Specifically, the Fourier transform of a negative frequency must have the same magnitude as the corresponding positive frequency, but opposite phase In other words, the Fourier transforms of the negative and positive frequency vectors are complex conjugates of one another; in X-ray crystallography, these corresponding reflections are called Friedel mates. This allows one to measure the full Fourier transform from only half the reciprocal space, e.g., by slightly more than a 180° rotation (see next section). In symmetric crystals, other reflections may have the same intensity (Bijvoet mates); in such cases, one can measure even less of the reciprocal space, e.g., slightly more than 90°. Ewald's sphere
Each X-ray diffraction image represents only a slice, a spherical slice of reciprocal space, as may be seen by the Ewald sphere construction. Both kout and kin have the same length, due to the elastic scattering, since the wavelength has not changed. Therefore, they may be represented as two radial vectors in a sphere in reciprocal space, which shows the values of q that are sampled in a given diffraction image. Since there is a slight spread in the incoming wavelengths of the incoming X-ray beam, the values of |F(q)| can be measured only for q vectors located between the two spheres corresponding to those radii. Therefore, to obtain a full set of Fourier transform data, it is necessary to rotate the crystal through slightly more than 180°, or sometimes less if sufficient symmetry is present. A full 360° rotation is not needed because of a symmetry intrinsic to the Fourier transforms of real functions (such as the electron density), but "slightly more" than 180° is needed to cover all of reciprocal space within a given resolution because of the curvature of the Ewald sphere (add Figure to illustrate this). In practice, the crystal is rocked by a small amount (0.25-1°) to incorporate reflections near the boundaries of the spherical Ewald shells. Patterson function
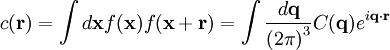
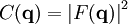
A well-known result of Fourier transforms is the autocorrelation theorem, which states that the autocorrelation c(r) of a function f(r) has a Fourier transform C(q)that is the squared magnitude of F(q) Therefore, the autocorrelation function c(r) of the electron density (also known as the Patterson function[69]) can be computed directly from the reflection intensities, without computing the phases. In principle, this could be used to determine the crystal structure directly; however, it is difficult to realize in practice. The autocorrelation function corresponds to the distribution of vectors between atoms in the crystal; thus, a crystal of N atoms in its unit cell may have N(N-1) peaks in its Patterson function. Given the inevitable errors in measuring the intensities, and the mathematical difficulties of reconstructing atomic positions from the interatomic vectors, this technique is rarely used to solve structures, except for the simplest crystals. See also
References
BibliographyInternational Tables for Crystallography
Bound collections of articles
Textbooks
Historical
Primary databases
Derivative databases
Structural validation
Categories: Crystallography | Diffraction | X-rays | Protein structure | Protein methods |
||||||||||||||||||||
| This article is licensed under the GNU Free Documentation License. It uses material from the Wikipedia article "X-ray_crystallography". A list of authors is available in Wikipedia. | ||||||||||||||||||||