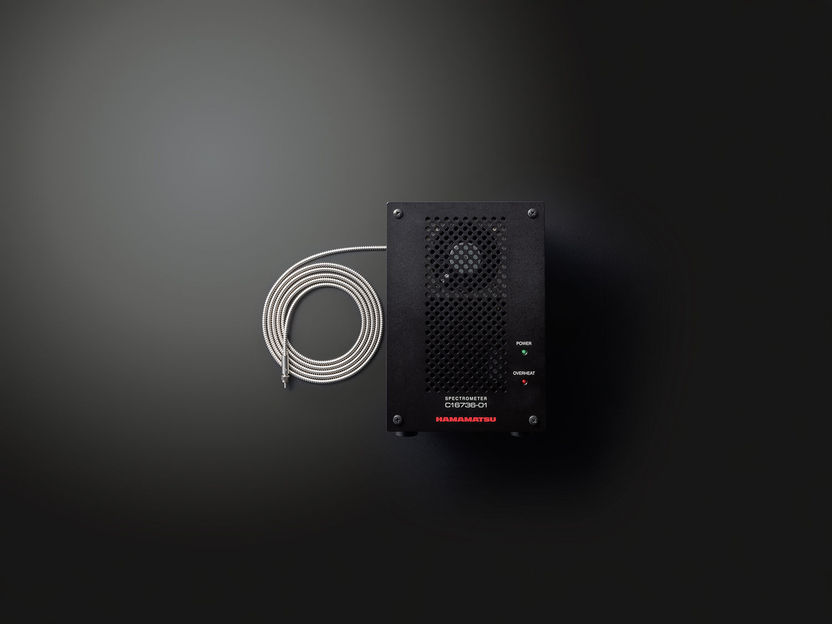
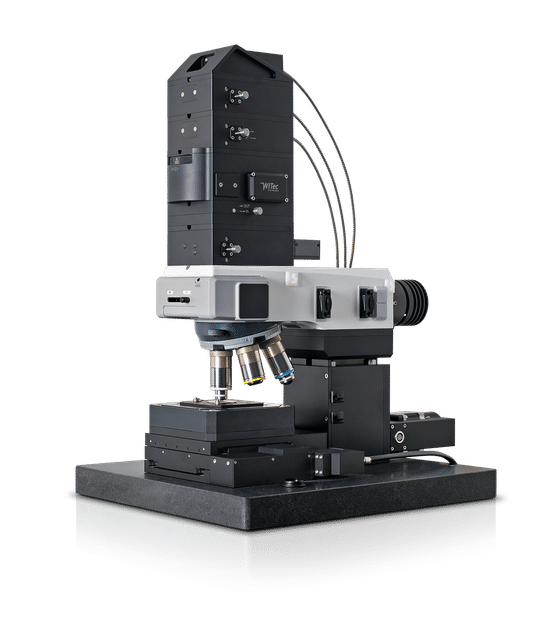


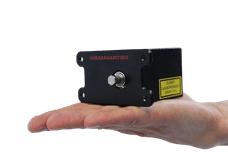


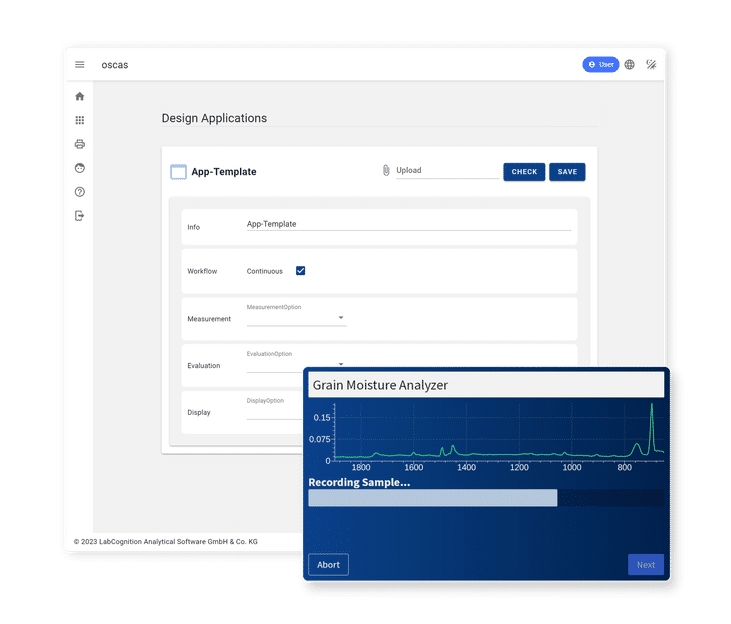


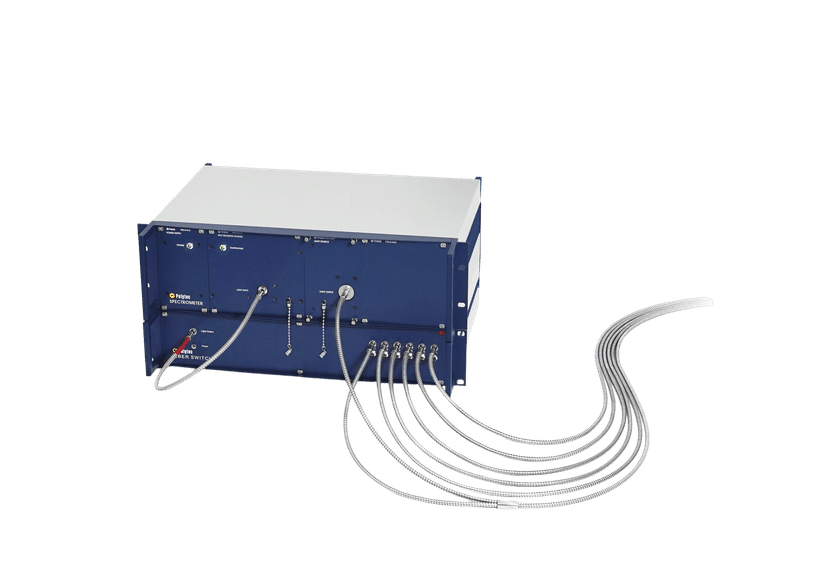


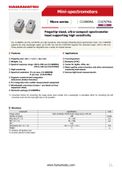


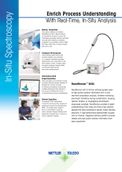


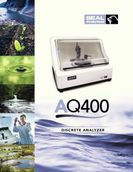


Non-destructive on-site analysis of organic substances using a small modular spectrometer platform
A compact and cost-effective alternative to expensive benchtop devices based on line sensors
Investigation with spectroscopy gives us unique insights into the composition and structure of materials. From UV-Vis spectroscopy to infrared and Raman spectroscopy to fluorescence and atomic absorption spectroscopy, spectroscopy offers us a wide range of analytical techniques to precisely characterize substances. Immerse yourself in the fascinating world of spectroscopy!


From now on, don't miss a thing: Our newsletter for the chemical industry, analytics, lab technology and process engineering brings you up to date every Tuesday and Thursday. The latest industry news, product highlights and innovations - compact and easy to understand in your inbox. Researched by us so you don't have to.
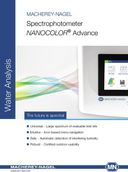
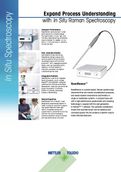
Photometry, the measurement of light intensity in relation to interaction with molecules, is a key tool in chemistry and life sciences. It enables researchers to determine concentrations of substances in solutions, follow reaction kinetics or check the quality of samples and provides valuable data for analyses, from quality control in the laboratory to clinical diagnostics.

Photometry, the measurement of light intensity in relation to interaction with molecules, is a key tool in chemistry and life sciences. It enables researchers to determine concentrations of substances in solutions, follow reaction kinetics or check the quality of samples and provides valuable data for analyses, from quality control in the laboratory to clinical diagnostics.
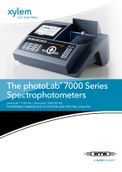
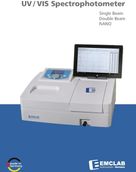
UV/Vis spectroscopy is a powerful tool in analytics. It uses the ultraviolet and visible light spectrum to measure the absorption of molecules, providing insights into their structure and concentration. Whether determining protein concentrations, characterizing compounds or monitoring chemical reactions, UV/Vis spectroscopy provides accurate and reproducible data.

UV/Vis spectroscopy is a powerful tool in analytics. It uses the ultraviolet and visible light spectrum to measure the absorption of molecules, providing insights into their structure and concentration. Whether determining protein concentrations, characterizing compounds or monitoring chemical reactions, UV/Vis spectroscopy provides accurate and reproducible data.
From now on, don't miss a thing: Our newsletter for the chemical industry, analytics, lab technology and process engineering brings you up to date every Tuesday and Thursday. The latest industry news, product highlights and innovations - compact and easy to understand in your inbox. Researched by us so you don't have to.
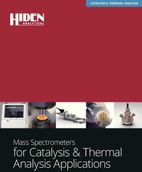
Absorption spectroscopy Absorption spectroscopy refers to a range of techniques employing the interaction of electromagnetic radiation with matter. (Spectroscopy is a word that has come to denote an even wider variety of techniques used in physics and chemistry .) In absorption spectroscopy, t ...
View articleFluorescence spectroscopy Fluorescence spectroscopy or fluorometry or spectrofluorimetry is a type of electromagnetic spectroscopy which analyzes fluorescence from a sample. It involves using a beam of light, usually ultraviolet light , that excites the electrons in molecules of certain compo ...
View articleFourier transform spectroscopy Fourier transform spectroscopy is a measurement technique whereby spectra are collected based on measurements of the temporal coherence of a radiative source, using time-domain measurements of the electromagnetic radiation or other type of radiation. It can be ap ...
View articleInfrared spectroscopy Infrared spectroscopy (IR spectroscopy) is the subset of spectroscopy that deals with the infrared region of the electromagnetic spectrum . It covers a range of techniques, the most common being a form of absorption spectroscopy . As with all spectroscopic techniques , it can ...
View articleNear infrared spectroscopy showing complicated overlapping overtones of mid IR absorption features. Near infrared spectroscopy (NIRS) is a spectroscopic method utilising the near infra-red region of the electromagnetic spectrum (from about 800 nm to 2500 nm). Typical applications include pharm ...
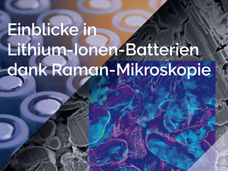
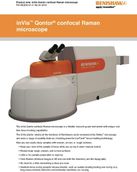
View articleRaman spectroscopy Raman spectroscopy is a spectroscopic technique used in condensed matter physics and chemistry to study vibrational, rotational, and other low-frequency modes in a system. It relies on inelastic scattering, or Raman scattering of monochromatic light, usually from a laser in ...
View articleSpectrophotometry In physics , spectrophotometry is the quantitative study of electromagnetic spectra . It is more specific than the general term electromagnetic spectroscopy in that spectrophotometry deals with visible light, near-ultraviolet , and near-infrared . Also, the term does not cover ...
View articleSpectroscopy Spectroscopy is the study of the interaction between radiation (electromagnetic radiation , or light, as well as particle radiation ) and matter . Spectrometry is the measurement of these interactions and an instrument which performs such measurements is a spectrometer or spectrogra ...
View articleFrom structure analyses to forensic investigations – spectroscopy applications can serve many purposes ...
View articleThese are the spectroscopic methods that analytical laboratories rely on ...
View article© 1997-2024 LUMITOS AG, All rights reserved