To use all functions of this page, please activate cookies in your browser.
My watch list
my.chemeurope.com
my.chemeurope.com
With an accout for my.chemeurope.com you can always see everything at a glance – and you can configure your own website and individual newsletter.
- My watch list
- My saved searches
- My saved topics
- My newsletter
MA plot
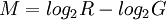
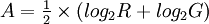
MA plots are used to visualize intensity-dependent ratio of raw microarray data. The MA plot uses M as the y-axis and A as the x-axis where M and A are usually defined as: |
||
| This article is licensed under the GNU Free Documentation License. It uses material from the Wikipedia article "MA_plot". A list of authors is available in Wikipedia. |
Last viewed


