To use all functions of this page, please activate cookies in your browser.
My watch list
my.chemeurope.com
my.chemeurope.com
With an accout for my.chemeurope.com you can always see everything at a glance – and you can configure your own website and individual newsletter.
- My watch list
- My saved searches
- My saved topics
- My newsletter
Relaxation (NMR)
In nuclear magnetic resonance (NMR) spectroscopy and magnetic resonance imaging (MRI) the term relaxation describes several processes by which nuclear magnetization prepared in a non-equilibrium state return to the equilibrium distribution. In other words, relaxation describes how fast spins "forget" the direction in which they are oriented. The rates of this spin relaxation can be measured in both spectroscopy and imaging applications. Product highlight
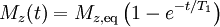
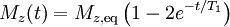
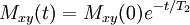
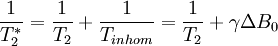
T1 and T2Different physical processes are responsible for the relaxation of the components of the nuclear spin magnetization vector M parallel perpendicular to the external magnetic field, B0 (which is conventionally oriented along the z axis). These two principal relaxation processes are termed T1 and T2 relaxation respectively. T1The longitudinal relaxation time T1 is the decay constant for the recovery of the z component of the nuclear spin magnetization, Mz, towards its thermal equilibrium value, Mz,eq. In general, In specific cases:
i.e. the magnetisation recovers to 63% of its equilibrium value after one time constant T1.
T1 relaxation involves redistributing the populations of the nuclear spin states in order to reach the thermal equilibrium distribution. By definition this is not energy conserving. Moreover, spontaneous emission is negligibly slow at NMR frequencies. Hence truly isolated nuclear spins would show negligible rates of T1 relaxation. However, a variety of relaxation mechanisms allow nuclear spins to exchange energy with their surroundings, the lattice, allowing the spin populations to equilibrate. The fact that T1 relaxation involves an interaction with the surroundings is the origin of the alternative description, spin-lattice relaxation. Note that the rates of T1 relaxation are generally strongly dependent on the NMR frequency and so may vary considerably with magnetic field strength, B. T2The transverse relaxation time T2 is the decay constant for the component of M perpendicular to B0, designated Mxy, MT, or i.e. the transverse magnetization vector drops to 37% of its original magnitude after one time constant T2. T2 relaxation is a complex phenomenon, but at its most fundamental level, it corresponds to a decoherence of the transverse nuclear spin magnetization. Random fluctuations of the local magnetic field lead to random variations in the instantaneous NMR precession frequency of different spins. As a result, the intial phase coherence of the nuclear spins is lost, until eventually the phases are disordered and there is no net xy magnetization. Because T2 relaxation involves only the phases of other nuclear spins it is often called "spin-spin" relaxation. T2 values are generally much less dependent on field strength, B, than T1 values. T2* and magnetic field inhomogeneityIn an idealized system, all nuclei in a given chemical environment in a magnetic field spin with the same frequency. However, in real systems, there are minor differences in chemical environment which can lead to a distribution of resonance frequencies around the ideal. Over time, this distribution can lead to a dispersion of the tight distribution of magnetic spin vectors, and loss of signal (Free Induction Decay). In fact, for most magnetic resonance experiments, this "relaxation" dominates. This results in intra-voxel dephasing. However, decoherence because of magnetic field inhomogeneity is not a true "relaxation" process; it is not random, but dependent on the location of the molecule in the magnet. For molecules that aren't moving, the deviation from ideal relaxation is consistent over time, and the signal can be recovered by performing a spin echo experiment. The corresponding transverse relaxation time constant is thus T2*, which is usually much smaller than T2. The relation between them is: where γ represents gyromagnetic ratio, and ΔB0 the difference in strength of the locally varying field. Unlike T2, T2* is influenced by magnetic field gradient irregularities. The T2* relaxation time is always shorter than the T2 relaxation time and is typically milliseconds for water samples in imaging magnets. The reason that T1 is slower than T2As a general rule, the following always holds true: T1 > T2 > T2*. If T2 were to be slower than T1, then the magnetizations perpendicular to the initial direction would have not dephased by the time the sample had returned to equilibrium. This is physically impossible, as once the sample has returned to equilibrium, there is no magnetization perpendicular to the original direction. Hence, T1 must be greater than or equal to T2. Common relaxation time constants in human tissuesFollowing is a table of the approximate values of the two relaxation time constants for nonpathological human tissues, just for simple reference.
Following is a table of the approximate values of the two relaxation time constants for chemicals that commonly show up in human brain magnetic resonance spectroscopy (MRS) studies, physiologically or pathologically.
Microscopic mechanismIn 1948, Nicolaas Bloembergen, Edward Mills Purcell, and R.V. Pound proposed the so-called Bloembergen-Purcell-Pound theory (BPP theory) to explain the relaxation constant of a pure substance in correspondence with its state, taking into account the effect of tumbling motion of molecules on the local magnetic field disturbance . The theory was in good agreement with the experiments for pure substance, but not for complicated environment such as human body. From this theory, one can get T1、T2:
where ω0 is the Larmor frequency in correspondence with the strength of the main magnetic field B0. τc is the correlation time of the molecular tumbling motion. Taking for example the H2O molecules in liquid phase without the contamination of oxygen 17, the value of K is 1.02×10¹⁰ s-2 and the correlation time τc is on the order of picoseconds = 10 − 12 s, while hydrogen nuclei 1H (protons) at 1.5 teslas carry an Larmor frequency of approximately 64 MHz. We can then estimate using τc = 5×10-12 s:
which is close to the experimental value, 3.6 s. Meanwhile, we can see that at this extreme case, T1 equals T2. References
See also
|
|||||||||||||||||||||||||||||||||||||||||||||||||
| This article is licensed under the GNU Free Documentation License. It uses material from the Wikipedia article "Relaxation_(NMR)". A list of authors is available in Wikipedia. |

![M_z(t) = M_{z,\mathrm{eq}} - [M_{z,\mathrm{eq}} - M_z(0)]e^{-t/T_1}](images/math/5/f/b/5fbe47b5e577a0b83fa97f3677050256.png)
 . For instance, initial xy magnetisation at time zero will decay to zero (i.e. equilibrium) as follows:
![\frac{1}{T_1}=K[\frac{\tau_c}{1+\omega_0^2\tau_c^2}+\frac{4\tau_c}{1+4\omega_0^2\tau_c^2}]](images/math/a/7/f/a7fa82e22e7a1346db3dacb022120638.png)
![\frac{1}{T_2}=\frac{K}{2}[3\tau_c+\frac{5\tau_c}{1+\omega_0^2\tau_c^2}+\frac{2\tau_c}{1+4\omega_0^2\tau_c^2}]](images/math/c/c/0/cc03ba1783bc6168e9526b3b87b91ac6.png) ,
,
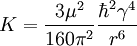 is a constant with μ being the
  the reduced Planck constant, γ the
 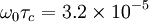 (dimensionless)
![T_1=(1.02\times 10^{10}[\frac{ 5\times 10^{-12} }{1 + (3.2\times 10^{-5} )^2} + \frac{ 4\cdot 5\times 10^{-12} }{1 + 4\cdot (3.2\times 10^{-5} )^2}])^{-1}](images/math/c/1/6/c166764d49ca60d20aa2693e3032b856.png) = 3.92 s
= 3.92 s
![T_2=(\frac{1.02\times 10^{10}}{2}[3\cdot 5\times 10^{-12} + \frac{5\cdot 5\times 10^{-12} }{1 + (3.2\times 10^{-5} )^2} + \frac{ 2\cdot 5\times 10^{-12} }{1 + 4\cdot (3.2\times 10^{-5} )^2}])^{-1}](images/math/8/d/d/8ddac8923f4fcca7e86cf174e923a260.png) = 3.92 s,
= 3.92 s,


