Verified
WS Series
Compact, High-Resolution Mini-spectrometers for UV to NIR Spectroscopy
Hamamatsu Photonics Deutschland GmbH
Spectral resolution down to 0.45 nm FWHM (typ.) for precise material characterization.
Broad UV-to-NIR coverage (190–1100 nm) with 16-bit A/D conversion in one device
USB bus-powered, no external supply needed — plug-and-play integration into any setup
 New
New
Highly versatile mini-spectrometer ideal for modern spectroscopy
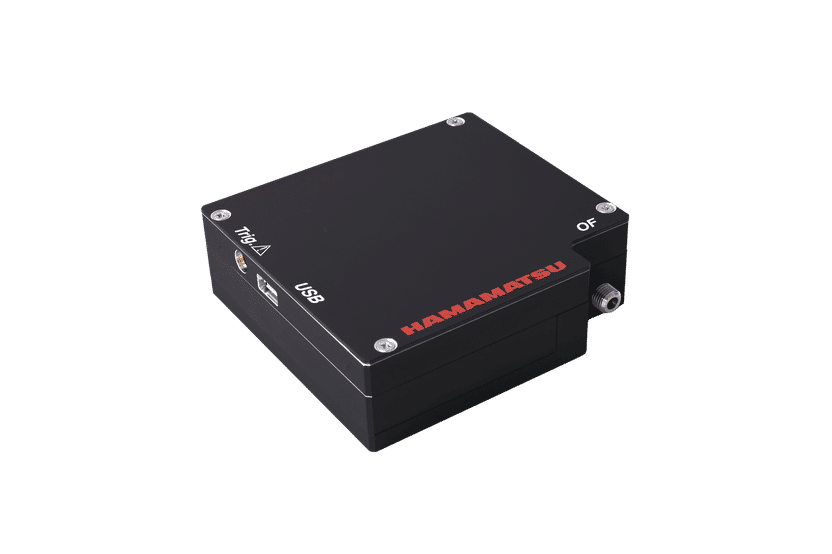
The WS Series mini-spectrometers from Hamamatsu Photonics combine a reflective grating optical system, a high-sensitivity CMOS linear image sensor with 2048 pixels, and an integrated driver circuit — all within a compact enclosure measuring just 80 × 75 × 25 mm and weighing 197 g. Two models address distinct application requirements: the C16449MA-01 for wide spectral coverage and the C16449MA-02 for demanding high-resolution tasks such as Laser-Induced Breakdown Spectroscopy (LIBS).
Wide Spectral Range and High Resolution
The C16449MA-01 covers a spectral response range of 190 to 1100 nm, making it suitable for applications spanning deep UV to near-infrared — including color measurement, gas analysis, and film thickness measurements. Its typical spectral resolution (FWHM) is 1.0 nm, with a maximum of 2.0 nm. The C16449MA-02 is optimized for the 200 to 600 nm range and delivers a typical resolution of 0.45 nm FWHM (max. 0.7 nm), enabling the fine spectral discrimination required in LIBS and other high-resolution spectroscopy tasks. Both models offer a wavelength reproducibility of ±0.2 nm and a spectral stray light specification of -35 dB max.
High-Sensitivity CMOS Sensor and Flexible Integration
The built-in high-sensitivity CMOS image sensor achieves sensitivity comparable to CCD-based systems while maintaining low power consumption. The device is fully USB bus-powered (typ. 250 mA, max. 330 mA), eliminating the need for an external power supply. Spectrum data is acquired by coupling measurement light via an SMA905 optical fiber connector and transferring results to a PC over USB 2.0. Integration time is adjustable from 11 to 100,000 μs, supporting a wide dynamic range of measurement scenarios.
Trigger Modes for Pulsed and Synchronized Measurements
Four trigger operation modes are available, covering edge-triggered and level-triggered synchronous and asynchronous acquisition. This enables precise spectroscopic measurement of pulse emissions — a key requirement in LIBS and time-resolved spectroscopy. The shutter function further extends measurement flexibility.
Software and Customization
Each unit ships with free evaluation software (HiasDataViewer, compatible with Microsoft® Windows® 11 Professional 64-bit) for data acquisition, condition setting, graph display, dark subtraction, and Gaussian peak approximation. DLL specifications are openly disclosed, allowing users to develop custom measurement software. Spectral response range and spectral resolution can be customized as options, and a dedicated UV/visible optical fiber (600 µm core, NA=0.22, 1.5 m length) is available separately.
1
WS Series Mini Spectrometers
Request information about WS Series now
WS Series
Compact, High-Resolution Mini-spectrometers for UV to NIR Spectroscopy

Product classification WS Series
Product categories
Applications
Manufacturers of similar products


Find WS Series and related products in the theme worlds
Topic world UV/Vis spectroscopy
UV/Vis spectroscopy is a powerful tool in analytics. It uses the ultraviolet and visible light spectrum to measure the absorption of molecules, providing insights into their structure and concentration. Whether determining protein concentrations, characterizing compounds or monitoring chemical reactions, UV/Vis spectroscopy provides accurate and reproducible data.

Topic world UV/Vis spectroscopy
UV/Vis spectroscopy is a powerful tool in analytics. It uses the ultraviolet and visible light spectrum to measure the absorption of molecules, providing insights into their structure and concentration. Whether determining protein concentrations, characterizing compounds or monitoring chemical reactions, UV/Vis spectroscopy provides accurate and reproducible data.
Topic World Spectroscopy
Investigation with spectroscopy gives us unique insights into the composition and structure of materials. From UV-Vis spectroscopy to infrared and Raman spectroscopy to fluorescence and atomic absorption spectroscopy, spectroscopy offers us a wide range of analytical techniques to precisely characterize substances. Immerse yourself in the fascinating world of spectroscopy!

Topic World Spectroscopy
Investigation with spectroscopy gives us unique insights into the composition and structure of materials. From UV-Vis spectroscopy to infrared and Raman spectroscopy to fluorescence and atomic absorption spectroscopy, spectroscopy offers us a wide range of analytical techniques to precisely characterize substances. Immerse yourself in the fascinating world of spectroscopy!