LabCognition
oscas
Spectroscopy Apps for Routine Spectrum Analysis
You know apps from your mobile phone. What if spectral data analysis and evaluation in your routine analysis could be done just as easily with an app?
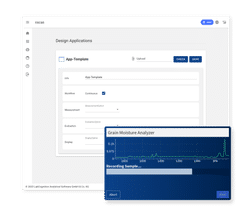
With the oscas spectroscopy apps you can save valuable resources and complete your routine analysis within a few clicks. The standardised apps guide users through the data acquisition and evaluation process in a time-efficient manner while ensuring a low error rate.
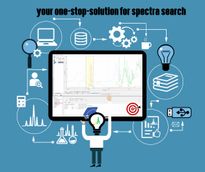
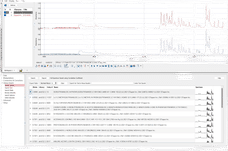
Experience result-oriented apps, e.g. for material identification based on optical spectroscopy data! Analyse food, plastics, pharmaceuticals and medicines, environmentally hazardous substances and poisons as well as forensic and many other materials. All you need is a spectrum of your sample.
You have other requirements for your analyses? No problem! Define your own app in the form of an evaluation sequence using our oscas cloud software or contact us. We will be happy to help and create apps for you.
Product classification oscas
Product categories
Applications
Manufacturers of similar products


Find more spectral databases and related products
Find oscas and related products in the theme worlds
Topic world UV/Vis spectroscopy
UV/Vis spectroscopy is a powerful tool in analytics. It uses the ultraviolet and visible light spectrum to measure the absorption of molecules, providing insights into their structure and concentration. Whether determining protein concentrations, characterizing compounds or monitoring chemical reactions, UV/Vis spectroscopy provides accurate and reproducible data.
Topic World Spectroscopy
Investigation with spectroscopy gives us unique insights into the composition and structure of materials. From UV-Vis spectroscopy to infrared and Raman spectroscopy to fluorescence and atomic absorption spectroscopy, spectroscopy offers us a wide range of analytical techniques to precisely characterize substances. Immerse yourself in the fascinating world of spectroscopy!