Ocean acidification in coloured stripes
Making environmental changes visible

Advertisement


Our oceans are acidifying rapidly. Climate researchers from ETH Zurich are now illustrating these chemical changes with colour-coded stripes. Global observations of ocean acidification over the last four decades serve as the basis.
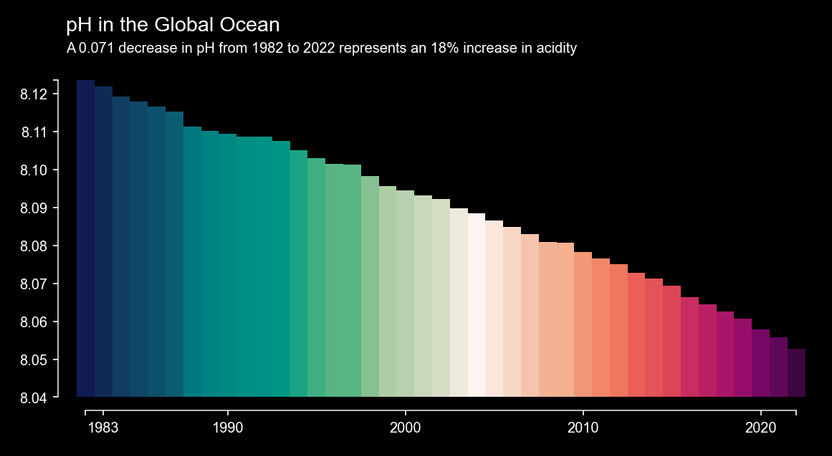
The pH value of the global ocean decreased by 0.071 units from 1982 to 2021. Since the pH value is on a logarithmic scale, this corresponds to an increase in acidity of 18 percent.
Nicolas Gruber & Luke Gregor / ETH Zürich
Most people consider climate change to consist only of the warming of the atmosphere, the consequences of which primarily affect land regions. However, this is a human-centred view and does not go far enough.
This view overlooks the fact that the oceans are also strongly affected by climate change. Not only do they absorb a large part of the extra heat that the increased concentration of greenhouse gases generate in the atmosphere – they also absorb about one third of man-made CO2 emissions from the atmosphere. This CO2 uptake causes the oceans to acidify – with significant consequences for marine life.

"Despite these profound changes, many people are not aware of what is happening to our oceans," says Nicolas Gruber, Professor of Environmental Physics at ETH Zurich. The marine researcher and his team want to change that.
But how can people understand such an abstract concept for a complex process in an unfamiliar habitat?
Making environmental changes visible
The researchers' answer is "ocean acidification stripes" – a web-based graphic tool that depicts ocean acidification in different ocean regions over time in an intuitive manner using colour-coded stripes. The format and appearance of the "acidification stripes" are deliberately inspired by the well-known "temperature stripes" or "climate stripes" by the British climate scientist Ed Hawkins.
"We aim to make ocean acidification more visible and raise awareness that this environmental change is another major consequence of anthropogenic CO2 emissions alongside atmospheric warming," explains Gruber.
A stressful milieu for marine life
When CO2 is dissolved in the water, carbonic acid forms. This process acidifies the sea – the pH value drops. A part of the carbonic acid reacts with the carbonate ions dissolved in seawater, causing a decrease of the saturation state of seawater with regard to carbonate minerals such as aragonite (the building material of corals).
Both chemical processes are particularly harmful to those marine organisms that depend on calcareous shells built from carbonate minerals, including various plankton species, mussels, and corals. "Since these organisms are often at the base of the food chain, they are critical for many marine ecosystems and thus also relevant for us humans," says Gruber.
The new ETH strip generator is freely accessible and allows users to visualise the change in acidity (pH) or aragonite saturation in over 60 regions. For example, anyone interested in the degree of ocean acidification at their holiday destination can select the corresponding ocean region and generate the acidification strips him or herself.
Trends and drivers of acidification confirmed
The scientific basis for the visualisation is an observation-based dataset on ocean acidification called OceanSODA-ETHZ. It covers almost all ocean regions over the last forty years (1982 to 2021). OceanSODA-ETHZ was created in 2021 by Gruber’s postdoctoral researcher Luke Gregor, who combined ship measurements and satellite data using machine learning.
With this observation-based dataset, Gruber’s team has now been able to investigate the trends and drivers of acidification: In a study in Global Biogeochemical Cycles, the researchers used these data to show for the first time how ocean acidification has developed worldwide in recent decades.
First author Danling Ma: "It is well established that the oceans absorb CO2 from the atmosphere and acidify. But a worldwide increase has so far only been insufficiently confirmed by observations," explains the master’s student in Gruber's team. The researchers have now closed this gap.
"Our results confirm that pH and aragonite saturation have decreased throughout the global ocean and that these trends are mainly due to the increase in dissolved inorganic carbon taken up from the atmosphere," Ma concludes.
The researchers can thus clearly prove that man-made CO2 emissions are causing the ongoing ocean acidification.
Original publication


Other news from the department science