To use all functions of this page, please activate cookies in your browser.
My watch list
my.chemeurope.com
my.chemeurope.com
With an accout for my.chemeurope.com you can always see everything at a glance – and you can configure your own website and individual newsletter.
- My watch list
- My saved searches
- My saved topics
- My newsletter
Infrared spectroscopyInfrared spectroscopy (IR spectroscopy) is the subset of spectroscopy that deals with the infrared region of the electromagnetic spectrum. It covers a range of techniques, the most common being a form of absorption spectroscopy. As with all spectroscopic techniques, it can be used to identify compounds or investigate sample composition. Infrared spectroscopy correlation tables are tabulated in the literature. Product highlight
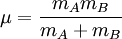
TheoryThe infrared portion of the electromagnetic spectrum is divided into three regions; the near-, mid- and far- infrared, named for their relation to the visible spectrum. The far-infrared, approximately 400-10 cm-1 (1000–30 μm), lying adjacent to the microwave region, has low energy and may be used for rotational spectroscopy. The mid-infrared, approximately 4000-400 cm-1 (30–1.4 μm) may be used to study the fundamental vibrations and associated rotational-vibrational structure. The higher energy near-IR, approximately 14000-4000 cm-1 (1.4–0.8 μm) can excite overtone or harmonic vibrations. The names and classifications of these subregions are merely conventions. They are neither strict divisions nor based on exact molecular or electromagnetic properties. Infrared spectroscopy exploits the fact that molecules have specific frequencies at which they rotate or vibrate corresponding to discrete energy levels. These resonant frequencies are determined by the shape of the molecular potential energy surfaces, the masses of the atoms and, by the associated vibronic coupling. In order for a vibrational mode in a molecule to be IR active, it must be associated with changes in the permanent dipole. In particular, in the Born-Oppenheimer and harmonic approximations, i.e. when the molecular Hamiltonian corresponding to the electronic ground state can be approximated by a harmonic oscillator in the neighborhood of the equilibrium molecular geometry, the resonant frequencies are determined by the normal modes corresponding to the molecular electronic ground state potential energy surface. Nevertheless, the resonant frequencies can be in a first approach related to the strength of the bond, and the mass of the atoms at either end of it. Thus, the frequency of the vibrations can be associated with a particular bond type. Simple diatomic molecules have only one bond, which may stretch. More complex molecules have many bonds, and vibrations can be conjugated, leading to infrared absorptions at characteristic frequencies that may be related to chemical groups. For example, the atoms in a CH2 group, commonly found in organic compounds can vibrate in six different ways: symmetrical and antisymmetrical stretching, scissoring, rocking, wagging and twisting:
The infrared spectra of a sample is collected by passing a beam of infrared light through the sample. Examination of the transmitted light reveals how much energy was absorbed at each wavelength. This can be done with a monochromatic beam, which changes in wavelength over time, or by using a Fourier transform instrument to measure all wavelengths at once. From this, a transmittance or absorbance spectrum can be produced, showing at which IR wavelengths the sample absorbs. Analysis of these absorption characteristics reveals details about the molecular structure of the sample. This technique works almost exclusively on samples with covalent bonds. Simple spectra are obtained from samples with few IR active bonds and high levels of purity. More complex molecular structures lead to more absorption bands and more complex spectra. The technique has been used for the characterization of very complex mixtures. Sample preparationGaseous samples require little preparation beyond purification, but a sample cell with a long pathlength (typically 5-10 cm) is normally needed, as gases show relatively weak absorbances. Liquid samples can be sandwiched between two plates of a high purity salt (commonly sodium chloride, or common salt, although a number of other salts such as potassium bromide or calcium fluoride are also used). The plates are transparent to the infrared light and will not introduce any lines onto the spectra. Some salt plates are highly soluble in water, so the sample and washing reagents must be anhydrous (without water). Solid samples can be prepared in two major ways. The first is to crush the sample with a mulling agent (usually nujol) in a marble or agate mortar, with a pestle. A thin film of the mull is applied onto salt plates and measured. The second method is to grind a quantity of the sample with a specially purified salt (usually potassium bromide) finely (to remove scattering effects from large crystals). This powder mixture is then crushed in a mechanical die press to form a translucent pellet through which the beam of the spectrometer can pass. It is important to note that spectra obtained from different sample preparation methods will look slightly different from each other due to differences in the samples' physical states. The last technique is the Cast Film technique. Cast film technique is used mainly for polymeric compound. Sample is first dissolved in suitable, non hygroscopic solvent. A drop of this solution is deposited on surface of KBr or NaCl cell. The solution is then evaporated to dryness and the film formed on the cell is analysed directly. Care is important to ensure that the film is not too thick otherwise light cannot pass through. This technique is suitable for qualitative analysis. Typical methodA beam of infrared light is produced and split into two separate beams. One is passed through the sample, the other passed through a reference which is often the substance the sample is dissolved in. The beams are both reflected back towards a detector, however first they pass through a splitter which quickly alternates which of the two beams enters the detector. The two signals are then compared and a printout is obtained. A reference is used for two reasons:
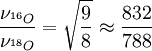
Summary of absorptions of bonds in organic moleculesWavenumbers listed in cm-1. Uses and applicationsInfrared spectroscopy is widely used in both research and industry as a simple and reliable technique for measurement, quality control and dynamic measurement. The instruments are now small, and can be transported, even for use in field trials. With increasing technology in computer filtering and manipulation of the results, samples in solution can now be measured accurately (water produces a broad absorbance across the range of interest, and thus renders the spectra unreadable without this computer treatment). Some machines will also automatically tell you what substance is being measured from a store of thousands of reference spectra held in storage. By measuring at a specific frequency over time, changes in the character or quantity of a particular bond can be measured. This is especially useful in measuring the degree of polymerization in polymer manufacture. Modern research machines can take infrared measurements across the whole range of interest as frequently as 32 times a second. This can be done whilst simultaneous measurements are made using other techniques. This makes the observations of chemical reactions and processes quicker and more accurate. Techniques have been developed to assess the quality of tea-leaves using infrared spectroscopy. This will mean that highly trained experts (also called 'noses') can be used more sparingly, at a significant cost saving.[1] Infrared spectroscopy has been highly successful for applications in both organic and inorganic chemistry. Infrared spectroscopy has also been successfully utilized in the field of semiconductor microelectronics[2]: for example, infrared spectroscopy can be applied to semiconductors like silicon, gallium arsenide, gallium nitride, zinc selenide, amorphous silicon, silicon nitride, etc. Isotope effectsThe different isotopes in a particular species may give fine detail in infrared spectroscopy. For example, the O-O stretching frequency of oxyhemocyanin is experimentally determined to be 832 and 788 cm-1 for ν(16O-16O) and ν(18O-18O) respectively. By considering the O-O as a spring, the wavelength of absorbance, ν can be calculated: where k is the spring constant for the bond, and μ is the reduced mass of the A-B system: (mi is the mass of atom i). The reduced masses for 16O-16O and 18O-18O can be approximated as 8 and 9 respectively. Thus Fourier transform infrared spectroscopyFourier transform infrared (FTIR) spectroscopy is a measurement technique for collecting infrared spectra. Instead of recording the amount of energy absorbed when the frequency of the infra-red light is varied (monochromator), the IR light is guided through an interferometer. After passing the sample the measured signal is the interferogram. Performing a mathematical Fourier transform on this signal results in a spectrum identical to that from conventional (dispersive) infrared spectroscopy. FTIR spectrometers are cheaper than conventional spectrometers because building of interferometers is easier than the fabrication of a monochromator. In addition, measurement of a single spectrum is faster for the FTIR technique because the information at all frequencies is collected simultaneously. This allows multiple samples to be collected and averaged together resulting in an improvement in sensitivity. Because of its various advantages, virtually all modern infrared spectrometers are FTIR instruments. Two-dimensional infrared spectroscopyTwo-dimensional infrared correlation spectroscopy analysis is the application of 2D correlation analysis on infrared spectra. By extending the spectral information of a perturbed sample, spectral analysis is simplified and resolution is enhanced. The 2D synchronous and 2D asynchronous spectra represent a graphical overview of the spectral changes due to a perturbation (such as a changing concentration or changing temperature) as well as the relationship between the spectral changes at two different wavenumbers. Nonlinear two-dimensional infrared spectroscopy[3][4] is the infrared version of correlation spectroscopy. Nonlinear two-dimensional infrared spectroscopy is a technique that has become available with the development of femtosecond infrared laser pulses. In this experiment first a set of pump pulses are applied to the sample. This is followed by a waiting time, where the system is allowed to relax. The waiting time typically lasts from zero to several picoseconds and the duration can be controlled with a resolution of tens of femtoseconds. A probe pulse is then applied resulting in the emission of a signal from the sample. The nonlinear two-dimensional infrared spectrum is a two-dimensional correlation plot of the frequency ω1 that was excited by the initial pump pulses and the frequency ω3 excited by the probe pulse after the waiting time. This allows the observation of coupling between different vibrational modes. Because of its extremely high time resolution it can be used to monitor molecular dynamics on a picosecond timescale. It is still a largely unexplored technique and is becoming increasingly popular for fundamental research. Like in two-dimensional nuclear magnetic resonance (2DNMR) spectroscopy this technique spreads the spectrum in two dimensions and allow for the observation of cross peaks that contain information on the coupling between different modes. In contrast to 2DNMR nonlinear two-dimensional infrared spectroscopy also involve the excitation to overtones. These excitations result in excited state absorption peaks located below the diagonal and cross peaks. In 2DNMR two distinct techniques, COSY and NOESY, are frequently used. The cross peaks in the first are related to the scalar coupling, while in the later they are related to the spin transfer between different nuclei. In nonlinear two-dimensional infrared spectroscopy analogs have been drawn to these 2DNMR techniques. Nonlinear two-dimensional infrared spectroscopy with zero waiting time corresponds to COSY and nonlinear two-dimensional infrared spectroscopy with finite waiting time allowing vibrational population transfer corresponds to NOESY. The COSY variant of nonlinear two-dimensional infrared spectroscopy has been used for determination of the secondary structure content proteins.[5] See also
References
|
||||||||||||||||
| This article is licensed under the GNU Free Documentation License. It uses material from the Wikipedia article "Infrared_spectroscopy". A list of authors is available in Wikipedia. |