“Rainbow color maps are pretty, but not suitable for science”
Researchers show distorted representation and perception of scientific results with colorful graphics and suggest alternatives
Advertisement


Colorful maps and figures with rainbow-colored gradients from scientific papers often serve as eye-catchers in journals and are readily shared in social media. Hydrologist Dr. Michael Stölzle from the Institute of Earth and Environmental Sciences at the University of Freiburg and Dr. Lina Stein from the University of Bristol in England have investigated the frequency and properties of so-called “rainbow color maps.” In their study, the researchers note that using a rainbow color map in scientific visualizations distorts the data representation. In addition, people with color vision deficiencies cannot interpret such images correctly. Stölzle and Stein published their findings in the journal Hydrology and Earth System Sciences.
Colorful, scientific images are more difficult to interpret for people with color vision deficiencies.
Michael Stölzle
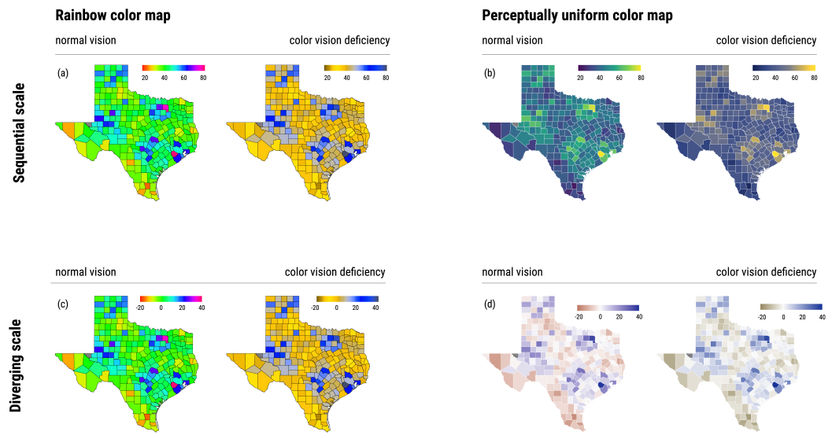
Cyan and yellow stand out
The research team reviewed visualizations from one thousand articles in scientific journals such as Nature Communications, Nature Scientific Reports and Hydrology and Earth System Science. About 24 percent of the articles showed graphics with a rainbow color map. The rainbow color map contains all color hues from blue to green to yellow to different shades of red. “In the visualizations, colors such as yellow and cyan clearly stand out, even though they represent only a small range of data variability,” explains Michael Stölzle. “When much larger ranges of data are represented by shades of green, blue, and red, however, their gradations can hardly be differentiated. As a result, rainbow color maps are not suitable for science.” Due to the non-linearity of the arrangement of the hues in the color map and the wide blue and red ranges, distortions between perception and actual data variety would arise. “Another problem is that people with color vision deficiencies are overlooked. In some regions of the world, up to ten percent of the male population lives with color vision deficiency (e.g., red-green blindness). They can’t even decipher the color map,” says Stölzle. In their paper, the researchers therefore present a 4-point plan to improve the use of color palettes in scientific visualizations. Among other things, they advise taking inspiration from black-and-white visualizations and using online tools such as color filters to test the impact of images for people with color vision deficiencies.
Need for action from journals, editors and reviewers
The issue with bright, colorful visualizations is nothing new. For the journals analyzed, the study shows that publications with rainbow color map have been popular for many years and the use has been increasing slightly since then. “In Particular, younger scientists are picking up the rainbow color map, in part because they were led to believe it was misleadingly correct in visualizations of previous publications.” However, Stölzle sees a need for action not only among researchers. Ultimately, journals, editors and reviewers will have to come together to ban the use of the rainbow color map in publications.
Original publication


Other news from the department science