To use all functions of this page, please activate cookies in your browser.
My watch list
my.chemeurope.com
my.chemeurope.com
With an accout for my.chemeurope.com you can always see everything at a glance – and you can configure your own website and individual newsletter.
- My watch list
- My saved searches
- My saved topics
- My newsletter
Circular dichroismCircular dichroism (CD) is a form of spectroscopy based on the differential absorption of left- and right-handed circularly polarized light. It can be used to determine the structure of macromolecules (including the secondary structure of proteins and the handedness of DNA). Product highlight
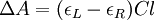
Polarized LightLinearly polarized light is polarized in a certain direction (i.e. the magnitude of its electric field vector oscillates only in one plane, similar to a sine wave). In circularly polarized light the electric field vector has a constant length, but rotates about its propagation direction. Hence, it forms a helix in space while propagating. If this is a left-handed helix the light is referred to as left circularly polarized and vice versa for a right handed helix. See external links for a demonstrative animation of the different types of electromagnetic waves. The electric field of a light beam causes a linear displacement of charge when interacting with a molecule, whereas the magnetic field of it causes a circulation of charge. These two motions combined result in a helical displacement when light is impinged on a molecule. Since circularly polarized light itself is "chiral", it interacts differently with chiral molecules. That is, one of the two types of circularly polarized light are absorbed to different extents. In a CD experiment, equal amounts of left and right circularly polarized light are radiated into a (chiral) solution. One of the two types is absorbed more than the other one and this wavelength dependent difference of absorption is measured, yielding the CD spectrum of the sample. Due to the interaction with the molecule, the electric field vector of the light traces out an elliptical path while propagating. At a given wavelength, where ΔA is the difference between absorbance of left circularly polarized (LCP) and right circularly polarized (RCP) light (this is what is usually measured). It can also be expressed, by applying Beer's law, as: where
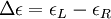
Then is the molar circular dichroism. This is what is usually meant by the circular dichroism of the substance. Although ΔA is usually measured, for historical reasons most measurements are reported in degrees of ellipticity. Molar circular dichroism and molar ellipticity, [θ], are readily interconverted by the equation:
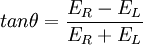
This relationship is derived by defining the ellipticity of the polarization as: where
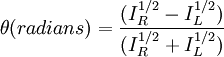
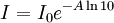
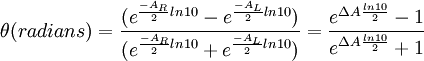
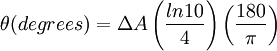
When ER equals EL (when there is no difference in the absorbance of right- and left-circular polarized light), θ is 0° and the light is linearly polarized. When either ER or EL is equal to zero (when there is complete absorbance of the circular polarized light in one direction), θ is 45° and the light is circularly polarized. Generally, the circular dichroism effect is small, so tanθ is small and can be approximated as θ in radians. Since the intensity or irradiance, I, of light is proportional to the square of the electric-field vector, the ellipticity becomes: Then by substituting for I using Beer's Law in natural logarithm form: The ellipticity can now be written as: Since ΔA<<1, this expression can be approximated by expanding the exponentials in a Taylor series to first-order and then discarding terms of ΔA in comparison with unity and converting from radians to degrees: The linear dependence of solute concentration and pathlength is removed by defining molar ellipticity as, Then combining the last two expression with Beer's Law, molar ellipticity becomes: Application to biological moleculesIn general, this phenomenon will be exhibited in absorption bands of any optically active molecule. As a consequence, circular dichroism is exhibited by biological molecules, because of the dextrorotary (e.g. some sugars) and levorotary (e.g. some amino acids) molecules they contain. Even more important is that a secondary structure will also impart a distinct CD to its respective molecules. Therefore, the alpha helix of proteins and the double helix of nucleic acids have CD spectral signatures representative of their structures. CD is closely related to the optical rotatory dispersion (ORD) technique, and is generally considered to be more advanced. CD is measured in or near the absorption bands of the molecule of interest, while ORD can be measured far from these bands. In principle these two spectral measurements can be interconverted through an integral transform, if all the absorptions are included in the measurements. The far-UV (ultraviolet) CD spectrum of proteins can reveal important characteristics of their secondary structure. CD spectra can be readily used to estimate the fraction of a molecule that is in the alpha-helix conformation, the beta-sheet conformation, the beta-turn conformation, or some other (e.g. random coil) conformation. These fractional assignments place important constraints on the possible secondary conformations that the protein can be in. CD cannot, in general, say where the alpha helices that are detected are located within the molecule or even completely predict how many there are. Despite this, CD is a valuable tool, especially for showing changes in conformation. It can, for instance, be used to study how the secondary structure of a molecule changes as a function of temperature or of the concentration of denaturing agents, e.g. Guanidinium hydrochloride or urea. In this way it can reveal important thermodynamic information (such as the enthalpy and Gibbs free energy of denaturation) about the molecule that cannot otherwise be easily obtained. Anyone attempting to study a protein will find CD a valuable tool for verifying that the protein is in its native conformation before undertaking extensive and/or expensive experiments with it. Also, there are a number of other uses for CD spectroscopy in protein chemistry not related to alpha-helix fraction estimation. The near-UV CD spectrum (>250 nm) of proteins provides information on the tertiary structure. The signals obtained in the 250-300 nm region are due to the absorption, dipole orientation and the nature of the surrounding environment of the phenylalanine, tyrosine, cysteine (or S-S disulphide bridges) and tryptophan amino acids. Unlike in far-UV CD, the near-UV CD spectrum cannot be assigned to any particular 3D structure. Near-UV CD spectra can also provide structural information on the nature of the prosthetic groups in proteins, such as heme groups e.g. in hemoglobin and cytochrome c. Visible CD spectroscopy is a very powerful technique to study metal–protein interactions and can resolve individual d-d electronic transitions as separate bands. CD spectra in the visible light region are only produced when a metal ion is in a chiral environment, thus, free metal ions in solution are not detected. This has the advantage of only observing the protein-bound metal, so pH dependence and stoichiometries are readily obtained. Optical activity in transition metal ion complexes have been attributed to configurational, conformational and the vicinal effects. Klewpatinond and Viles (2007) have produced a set of empirical rules for predicting the appearance of visible CD spectra for Cu2+ and Ni2+ square-planar complexes involving histidine and main-chain coordination. CD gives less specific structural information than e.g. X-ray crystallography or protein NMR spectroscopy, that both give atomic resolution data. However CD spectroscopy is a quick method, that does not require large amounts of proteins and extensive data processing. Thus CD can be used to survey a large number of solvent conditions, varying temperature, pH, salinity and presence of various cofactors. CD spectroscopy is usually used to study proteins in solution, and thus it complements methods that study the solid state. This is also a limitation, in that many proteins are embedded in membranes in their native state, and solutions containing membrane structures are often strongly scattering. CD is sometimes measured in thin films. Experimental limitationsCD has also been studied in carbohydrates, but with limited success due to the experimental difficulties associated with measurement of CD spectra in the vacuum ultraviolet (VUV) region of the spectrum (100-200 nm), where the corresponding CD bands of unsubstituted carbohydrates lie. Substituted carbohydrates with bands above the VUV region have been successfully measured. Measurement of CD is also complicated by the fact that typical aqueous buffer systems often absorb in the range where structural features exhibit differential absorption of circularly polarized light. Phosphate, sulfate, carbonate, and acetate buffers are generally incompatible with CD unless made extremely dilute e.g. in the 10-50 mM range. The TRIS buffer system should be completely avoided when performing far-UV CD. Borate and ammonium salts are often used to establish the appropriate pH range for CD experiments. Some experimenters have substituted fluoride for chloride ion because fluoride absorbs less in the far UV, and some have worked in pure water. Another, almost universal, technique is to minimize solvent absorption by using shorter path length cells when working in the far UV, 0.1 mm path lengths are not uncommon in this work. In addition to measuring in aqueous systems, CD, particularly far-UV CD, can be measured in organic solvents e.g. ethanol, methanol,trifluoroethanol (or TFE). The latter has the advantage to induce structure formation of proteins, inducing beta-sheets in some and alpha helices in others, which they would not show under normal aqueous conditions. Most common organic solvents such as acetonitrile, THF, chloroform, dichloromethane are however, incompatible with far-UV CD. It may be of interest to note that the protein CD spectra used in secondary structure estimation are related to the π to π* orbital absorptions of the amide bonds linking the amino acids. These absorption bands lie partly in the so-called vacuum ultraviolet (wavelengths less than about 200 nm). The wavelength region of interest is actually inaccessible in air because of the strong absorption of light by oxygen at these wavelengths. In practice these spectra are measured not in vacuum but in an oxygen-free instrument (filled with pure nitrogen gas). Once oxygen has been eliminated, perhaps the second most important technical factor in working below 200 nm is to design the rest of the optical system to have low losses in this region. Critical in this regard is the use of aluminized mirrors whose coatings have been optimized for low loss in this region of the spectrum. The usual light source in these instruments is a high pressure, short-arc xenon lamp. Ordinary xenon arc lamps are unsuitable for use in the low UV. Instead specially constructed lamps with envelopes made from high-purity synthetic fused silica must be used. Light from synchrotron sources has a much higher flux at short wavelengths, and has been used to record CD down to 160 nm. At the quantum mechanical level, the information content of circular dichroism and optical rotation are identical. See also
References
Categories: Polarization | Protein structure |
|||||||||||||||||||||
| This article is licensed under the GNU Free Documentation License. It uses material from the Wikipedia article "Circular_dichroism". A list of authors is available in Wikipedia. | |||||||||||||||||||||
![[\theta] = 3,298.2\Delta \epsilon\,](images/math/a/9/1/a915e8846cff4fe0f412786ab474f91e.png) .
.
![[\theta] = \frac {100\theta}{Cl}\,](images/math/0/7/d/07dcbd2d6a745af8ceb933ddbd4009ca.png)
![[\theta]= 100 \Delta \epsilon \left( \frac {ln10}{4} \right) \left( \frac {180}{\pi} \right) = 3,298.2\Delta \epsilon \,](images/math/e/9/3/e9348d179c468e3bbe9bfb165f683115.png)


