To use all functions of this page, please activate cookies in your browser.
My watch list
my.chemeurope.com
my.chemeurope.com
With an accout for my.chemeurope.com you can always see everything at a glance – and you can configure your own website and individual newsletter.
- My watch list
- My saved searches
- My saved topics
- My newsletter
Balmer seriesThe Balmer series or Balmer lines in atomic physics, is the designation of one of a set of six different named series describing the spectral line emissions of the hydrogen atom. The Balmer series is calculated using the Balmer formula, an empirical equation discovered by Johann Balmer in 1885. The visible spectrum of light from hydrogen displays four wavelengths, 410 nm, 434 nm, 486 nm, and 656 nm, that reflect emissions of photons by electrons in excited states transitioning to the quantum level described by the principal quantum number n equals 2. Product highlight
OverviewThe Balmer series is characterized by the electron transitioning from n ≥ 3 to n = 2, where n refers to the radial quantum number or principal quantum number of the electron. The transitions are named sequentially by Greek letter: n = 3 to n = 2 is called H-α, 4 to 2 is H-β, 5 to 2 is H-γ, and 6 to 2 is H-δ. As the first spectral lines associated with this series are located in the visible part of the electromagnetic spectrum, these lines are historically referred to as "H-alpha", "H-beta", "H-gamma" and so on, where H is the element hydrogen.
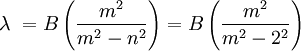
Although physicists were aware of atomic emissions before 1885, they lacked a tool to accurately predict where the spectral lines should appear. The Balmer equation predicts the four visible absorption/emission lines of hydrogen with high accuracy. Balmer's equation inspired the Rydberg equation as a generalization of it, and this in turn led physicists to find the Lyman, Paschen, and Brackett series which predicted other absorption/emission lines of hydrogen found outside the visible spectrum. The familiar red H-alpha spectral line of hydrogen gas, which is the transition from the shell n = 3 to the Balmer series shell n = 2, is one of the conspicuous colors of the universe. It contributes a bright red line to the spectra of emission or ionization nebula, like the Orion Nebula, which are often H II regions found in star forming regions. In true-color pictures, these nebula have a distinctly pink color from the combination of visible Balmer lines that hydrogen emits. Later, it was discovered that when the spectral lines of the hydrogen spectrum are examined at very high resolution, they are found to be closely-spaced doublets. This splitting is called fine structure. It was also found that excited atoms could jump to the Balmer series n=2 from orbitals where n was greater than 6, emitting shades of violet when doing so. Balmer's formulaBalmer noticed that a single number had a relation to every line in the hydrogen spectrum that was in the visible light region. That number was 364.56 nm. When any integer higher than 2 was squared and then divided by itself minus 4, then that number multiplied by 364.56 gave a wavelength of another line in the visible hydrogen spectrum. By this formula he was able to show that certain measurements of lines made in his time by spectroscopy were slightly inaccurate measurements and his formula predicted lines that were later found although had not yet been observed. His number also proved to be the limit of the series. The Balmer equation could be used to find the wavelength of the absorption/emission lines and was originally presented as follows (save for a notation change to give Balmer's constant as B): Where
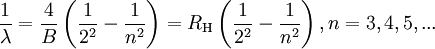
In 1888 the physicist Johannes Rydberg generalized the Balmer equation for all transitions of hydrogen. The equation commonly used to calculate the Balmer series is a specific example of the Rydberg formula and follows as a simple reciprocal mathematical rearrangement of the formula above (conventionally using a notation of n for m as the single integral constant needed): where λ is the wavelength of the absorbed/emitted light and RH is the Rydberg constant for hydrogen. The Rydberg constant is seen to be equal to 4/B in Balmer's formula, and for an infinitely heavy nucleus is 4/(3.6456*10-7m) = 10,973,735.3 m−1. Role in astronomyThe Balmer series is particularly useful in astronomy because the Balmer lines appear in numerous stellar objects due to the abundance of hydrogen in the universe, and therefore are commonly seen and relatively strong compared to lines from other elements. The spectral classification of stars, which is a primarily a determination of surface temperature, is based on the relative strength of spectral lines, and the Balmer series in particular are very important. Other characteristics of a star can be determined by close analysis of its spectrum include surface gravity (related to physical size) and composition. Because the Balmer lines are commonly seen in the spectra of various objects, they are often used to determine radial velocities due to doppler shifting of the Balmer lines. This has important uses all over astronomy, from detecting binary stars, exoplanets, compact objects such as neutron stars and black holes (by the motion of hydrogen in accretion disks around them), identifying groups of objects with similar motions and presumably origins (moving groups, star clusters, galaxy clusters, and debris from collisions), determining distances (actually redshifts) of galaxies or quasars, and identifying unfamiliar objects by analysis of their spectrum. Balmer lines can appear as absorption or emission lines in a spectrum, depending on the nature of the object observed. In stars, the Balmer lines are usually seen in absorption, and they are "strongest" in stars with a surface temperature of about 10,000 kelvin (spectral type A). In the spectra of most spiral and irregular galaxies, AGNs, H II regions and planetary nebulae, the Balmer lines are emission lines. In stellar spectra, the H-epsilon line (transition 7-2) is often mixed in with another absorption line caused by ionized calcium known by astronomers as "H" (the original designation given by Fraunhofer). That is, H-epsilon's wavelength is quite close to CaH at 396.847nm, and cannot be resolved in low resolution spectra. The H-zeta line (transition 8-2) is similarly mixed in with a neutral helium line seen in hot stars. See also
Categories: Emission spectroscopy | Hydrogen physics |
|||||||||||||||||||||||||||||||||||||||
| This article is licensed under the GNU Free Documentation License. It uses material from the Wikipedia article "Balmer_series". A list of authors is available in Wikipedia. |


 →2
→2
Last viewed


