To use all functions of this page, please activate cookies in your browser.
My watch list
my.chemeurope.com
my.chemeurope.com
With an accout for my.chemeurope.com you can always see everything at a glance – and you can configure your own website and individual newsletter.
- My watch list
- My saved searches
- My saved topics
- My newsletter
Vapor-liquid equilibrium
Vapor-liquid equilibrium, abbreviated as VLE by some, is a condition where a liquid and its vapor (gas phase) are in equilibrium with each other, a condition or state where the rate of evaporation (liquid changing to vapor) equals the rate of condensation (vapor changing to liquid) on a molecular level such that there is no net (overall) vapor-liquid interconversion. Although in theory equilibrium takes forever to reach, such an equilibrium is practically reached in a relatively closed location if a liquid and its vapor are allowed to stand in contact with each other long enough with no interference or only gradual intereference from the outside. Product highlight
VLE data introductionThe concentration of a vapor in contact with its liquid, especially at equilibrium, is often given in terms of vapor pressure, which could be a partial pressure (part of the total gas pressure) if any other gas(es) are present with the vapor. The equilibrium vapor pressure of a liquid is usually very dependent on temperature. At vapor-liquid equilibrium, a liquid with individual components (compounds) in certain concentrations will have an equilibrium vapor in which the concentrations or partial pressures of the vapor components will have certain set values depending on all of the liquid component concentrations and the temperature. This fact is true in reverse also; if a vapor with components at certain concentrations or partial pressures is in vapor-liquid equilibrium with its liquid, then the component concentrations in the liquid will be set dependent on the vapor concentrations, again also depending on the temperature. The equilibrium concentration of each component in the liquid phase is often different from its concentration (or vapor pressure) in the vapor phase, but there is a correlation. Such VLE concentration data is often known or can be determined experimentally for vapor-liquid mixtures with various components. In certain cases such VLE data can be determined or approximated with the help of certain theories such as Raoult's Law, Dalton's Law, and/or Henry's Law. Such VLE information is useful in designing columns for distillation, especially fractional distillation, which is a particular specialty of chemical engineers.[1][2][3] Distillation is a process used to separate or partially separate components in a mixture by boiling (vaporization) followed by condensation. Distillation takes advantage of differences in concentrations of components in the liquid and vapor phases. In mixtures containing two or more components where their concentrations are compared in the vapor and liquid phases, concentrations of each component are often expressed as mole fractions. A mole fraction is number of moles of a given component in an amount of mixture in a phase (either vapor or liquid phase) divided by the total number of moles of all components in that amount of mixture in that phase. Binary mixtures are those having two components. Three-component mixtures could be called ternary mixtures. There can be VLE data for mixtures with even more components, but such data becomes copious and is often hard to show graphically. VLE data is often shown at a certain overall pressure, such as 1 atm or whatever pressure a process of interest is conducted at. When at a certain temperature, the total of partial pressures of all the components becomes equal to the overall pressure of the system such that vapors generated from the liquid displace any air or other gas which maintained the overall pressure, the mixture is said to boil and the corresponding temperature is the boiling point (This assumes excess pressure is relieved by letting out gases to maintain a desired total pressure). A boiling point at an overall pressure of 1 atm is called the normal boiling point. Thermodynamic description of vapor-liquid equilibriumThe field of thermodynamics describes when vapor-liquid equilibrium is possible, and its properties. Much of the analysis depends on whether the vapor and liquid consist of a single component, of if they are mixtures. Pure (single-component) systemsIf the liquid and vapor are pure, in that they consist of only one molecular component and no impurities, then the equilibrium state between the two phases is described by the following equations:
where An equivalent, more common way to express the vapor-liquid equilibrium condition in a pure system is by using the concept of fugacity. Under this view, equilibrium is described by the following equation: where Multicomponent systemsIn a multicomponent system, where the vapor and liquid consist of more than one type of molecule, describing the equilibrium state is more complicated. For all components
where where Boiling point diagramsBinary mixture VLE data at a certain overall pressure, such as 1 atm, showing mole fraction vapor and liquid concentrations when boiling at various temperatures can be shown as a two-dimensional graph called a boiling point diagram. The mole fraction of component 1 in the mixture can be represented by the symbol x1. The mole fraction of component 2, represented by x2, is related to x1 in a binary mixture as follows: In multi-component mixtures in general with n components, this becomes: The preceding equations are typically applied for each phase (liquid or vapor) individually. In a binary boiling point diagram, temperature ( T ) is graphed vs. x1. At any given temperature where there is boiling going on, vapor with a certain mole fraction is in equilibrium with liquid with a certain mole fraction, often differing from the vapor. These vapor and liquid mole fractions are both on a horizontal isotherm (constant T ) line. When an entire range of boiling temperatures vs. vapor and liquid mole fractions is graphed, two (usually curved) lines are made. The lower one, representing boiling liquid mole fraction at various temperatures, is called a bubble point curve. The upper one, representing vapor mole fraction at corresponding temperatures, is called a dew point curve. [1] These two lines (or curves) meet where the mixture becomes purely one component, where x1 = 0 (and x2 = 1, pure component 2) or x1 = 1 (and x2 = 0, pure component 1). The temperatures at those two points correspond to the boiling points of the two pure components. In certain combinations of components, the two curves may also meet at a point somewhere in between x1 = 0 and x1 = 1. That point represents an azeotrope in that particular combination of components. That point has an azeotrope temperature and an azeotropic composition often represented as a mole fraction. There can be maximum-boiling azeotropes, where the azeotrope temperature is at a maximum in the boiling curves, or minimum-boiling azeotropes, where the azeotrope temperature is at a minimum in the boiling curves. If one wants to represent a VLE data for a three-component mixture as a boiling point "diagram", a three-dimensional graph can be used. Two of the dimensions would be used to represent the composition mole fractions, and the third dimension would be the temperature. Using two dimensions, the composition can be represented as an equilateral triangle in which each corner representing one of the pure components. The edges of the triangle represent a mixture of the two components at each end of the edge. Any point inside the triangle represent the composition of a mixture of all three components. The mole fraction of each component would correspond to where a point lies along a line starting at that component's corner and perpendicular to the opposite edge. The bubble point and dew point data would become curved surfaces inside a triangular prism, which connect the three boiling points on the vertical temperature "axes". Each face of this triangular prism would represent a two-dimensional boiling point diagram for the corresponding binary mixture. Due to their three-dimensional complexity, such boiling point diagrams are rarely seen. Alternately, the three-dimensional curved surfaces can be represented on a two-dimensional graph by the use of curved isotherm lines at graduated intervals, similar to iso-altitude lines on a map. Two sets of such isotherm lines are needed on such a two-dimensional graph: one set for the bubble point surface and another set for the dew point surface. K values and relative volatility valuesThere can be VLE data for mixtures of four or more components, but such a boiling point diagram is hard to show in either tabular or graphical form. For such multi-component mixtures, as well as binary mixtures, the vapor-liquid equilibrium data are represented in terms of K values (vapor-liquid distribution ratios)[1][2] defined by
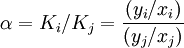
which are correlated empirically or theoretically in terms of temperature, pressure and phase compositions in the form of equations, tables or graph such as the well-known DePriester charts.[7][8] For binary mixtures, the ratio of the K values for the two components is called the relative volatility denoted by α which is a measure of the relative ease or difficulty of separating the two components. Large-scale industrial distillation is rarely undertaken if the relative volatility is less than 1.05 with the volatile component being i and the less volatile component being j.[2] K values are widely used in the design calculations of continuous distillation columns for distilling multicomponent mixtures. Vapor-Liquid Equilibrium diagramsFor each component in a binary mixture, one could make a vapor-liquid equilibrium diagram. Such a diagram would graph liquid mole fraction on a horizontal axis and vapor mole fraction on a vertical axis. In such VLE diagrams, liquid mole fractions for components 1 and 2 can be represented as x1 and x2 respectively, and vapor mole fractions of the corresponding components are commonly represented as y1 and y2. [2] Similarly for binary mixtures in these VLE diagrams: Such VLE diagrams are square with a diagonal line running from the (x1=0, y1=0) corner to the (x1=1, y1=1) corner for reference. These types of VLE diagrams are used in the McCabe-Thiele method to determine the number of equilibrium stages (or theoretical plates; same thing) needed to distill a given composition binary feed mixture into one distillate fraction and one bottoms fraction. Corrections can also be made to take into account the incomplete efficiency of each tray in a distillation column when compared to a theoretical plate. Raoult's LawAt boiling and higher temperatures the sum of the individual component partial pressures becomes equal to the overall pressure, which can symbolized as Ptot. Under such conditions, Dalton's Law would be in effect as follows: Then for each component in the vapor phase: where P1 = partial pressure of component 1, P2 = partial pressure of component 2, etc. Raoult's Law is an approximation which is approximately valid for mixtures of components between which there is very little interaction other than the effect of dilution by the other components. Examples of such mixtures includes mixtures of alkanes, which are non-polar, relatively inert compounds in many ways, so there is little attraction or repulsion between the molecules. Raoult's Law states that for components 1, 2, etc. in a mixture: where P01, P02, etc. are the vapor pressures of components 1, 2, etc. when they are pure, and x1, x2, etc. are mole fractions of the corresponding component in the liquid. Recall from the first section that vapor pressures of liquids are very dependent on temperature. Thus the P0pure vapor pressures for each component are a function of temperature ( T ): For example, commonly for a pure liquid component, the Clausius-Clapeyron equation (not shown here) may be used to approximate how the vapor pressure varies as a function of temperature. This makes each of the partial pressures dependent on temperature also regardless of whether Raoult's Law applies or not. When Raoult's Law is valid these expressions become: At boiling temperatures if Raoult's Law applies, the total pressure becomes: At a given Ptot such as 1 atm and a given liquid composition, T can be solved for to give the liquid mixture's boiling point or bubble point, although the solution for T may not be mathematically analytical (may require a numerical solution or approximation). For a binary mixture at a given Ptot, bubble point T can become a function of x1 (or x2) and this function can be shown on a two-dimensional graph like a binary boiling point diagram. At boiling temperatures if Raoult's Law applies, a number of the preceding equations in this section can be combined to give the following expressions for vapor mole fractions as a function of liquid mole fractions and temperature: y1 = x1 P01(T)/Ptot, y2 = x2 P02(T)/Ptot, ... etc.Once the bubble point T's as a function of liquid composition in terms of mole fractions have been determined, these values can be plugged into the above equations to obtain corresponding vapor composition in terms of mole fractions. When this is finished over a complete range of liquid mole fractions and their corresponding temperatures, one effectively obtains a temperature ( T ) function of vapor composition mole fractions. This function effectively acts as the dew point T function of vapor composition. In the case of a binary mixture: x2 = 1 - x1 and the above equations can be expressed as: y1 = x1 P01(T)/Ptot and y2 = (1 - x1) P02(T)/PtotFor many kinds of mixtures, particularly where there is interaction between components beyond simply the effects of dilution, Raoult's Law does not work well for determining the shapes of the curves in the boiling point or VLE diagrams. Even in such mixtures, there are usually still differences in the vapor and liquid equilibrium concentrations at most points, and distillation is often still useful for separating components at least partially. For such mixtures, empirical data is typically used in determining such boiling point and VLE diagrams. Chemical engineers have done a significant amount of research trying to develop equations for correlating and/or predicting VLE data for various kinds of mixtures which do not obey Raoult's Law well. See also
References
Categories: Thermodynamics | Chemical engineering | Physical chemistry | Distillation |
||||||||||||||||||||||
| This article is licensed under the GNU Free Documentation License. It uses material from the Wikipedia article "Vapor-liquid_equilibrium". A list of authors is available in Wikipedia. |
 ;
;
 ; and
; and

 and
and  are the
  and
and  are the
  and
and  are the molar
 and
and  are the
  and pressure
  .
. , the dimensionless fugacity coefficient, which is 1 for an
  in the system, the equilibrium state between the two phases is described by the following equations:

 and
and  are the temperature and pressure for each phase, and
  and
and  are the partial molar
 is the (extensive) Gibbs free energy, and
  is the